Concept of Traffic Flow Diagram

Traffic flow is the study of interactions between travelers (including pedestrians, cyclists, drivers, and their vehicles) and infrastructure (including highways, signage, and traffic control devices), with the aim of understanding and developing an optimal transport network with efficient movement of traffic and minimal traffic congestion problems.

Attempts to produce a mathematical theory of traffic flow date back to the 1920s, when Frank Knight first produced an analysis of traffic equilibrium, which was refined into Wardrop’s first and second principles of equilibrium in 1952.The fundamental diagram of traffic flow is a diagram that gives a relation between the traffic flux (vehicles/hour) and the traffic density (vehicles/km). A macroscopic traffic model involving traffic flux, traffic density and velocity forms the basis of the fundamental diagram. It can be used to predict the capability of a road system, or its behaviour when applying inflow regulation or speed limits.

Basic Premises

  • There is a connection between traffic density and vehicle velocity: The more vehicles are on a road, the slower their velocity will be.
  • To prevent congestion and to keep traffic flow stable, the number of vehicles entering the control zone has to be smaller or equal to the number of vehicles leaving the zone in the same time.
  • At a critical traffic density and a corresponding critical velocity the state of flow will change from stable to unstable.
  • If one of the vehicles brakes in unstable flow regime the flow will collapse.
    The primary tool for graphically displaying information in the study traffic flow is the fundamental diagram. Fundamental diagrams consist of three different graphs: flow-density, speed-flow, and speed-density. The graphs are two dimensional graphs. All the graphs are related by the equation “flow = speed * density”; this equation is the essential equation in traffic flow. The fundamental diagrams were derived by the plotting of field data points and giving these data points a best fit curve. With the fundamental diagrams researchers can explore the relationship between speed, flow, and density of traffic.

Speed-density

New Picture

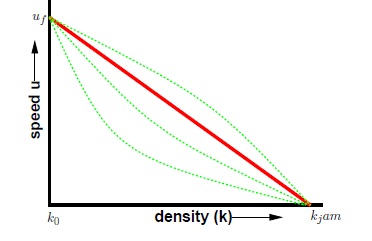
Speed Density Diagram

The speed-density relationship is linear with a negative slope; therefore, as the density increases the speed of the roadway decreases. The line crosses the speed axis, y, at the free flow speed, and the line crosses the density axis, x, at the jam density. Here the speed approaches free flow speed as the density approaches zero. As the density increases, the speed of the vehicles on the roadway decreases. The speed reaches approximately zero when the density equals the jam density.

Flow-density
In the study of traffic flow theory, the flow-density diagram is used to determine the traffic state of a roadway.
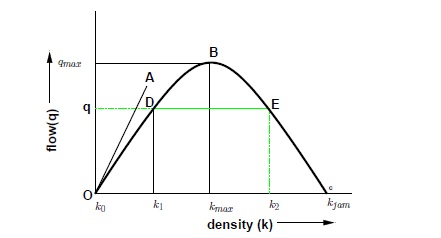
New Picture

Flow Density Curve

Currently, there are two types of flow density graphs. The first is the parabolic shaped flow-density curve, and the second is the triangular shaped flow-density curve. Academia views the triangular shaped flow-density curve as more the accurate representation of real world events. The triangular shaped curve consists of two vectors. The first vector is the free flow side of the curve. This vector is created by placing the free flow velocity vector of a roadway at the origin of the flow-density graph. The second vector is the congested branch, which is created by placing the vector of the shock wave speed at zero flo

w and jam density. The congested branch has a negative slope, which implies that the higher the density on the congested branch the lower the flow; therefore, even thoug

h there are more cars on the road, the number of cars passing a single point is less than if there were fewer cars on the road. The intersection of free flow and congested vectors is the apex of the curve and is considered the capacity of the roadway, which is the traffic condition at which the maximum number of vehicles can pass by a point in a given time period. The flow and capacity at which this point occurs is the optimum flow and optimum density, respectively. The flow density diagram is used to give the traffic condition of a roadway. With the traffic conditions, time-space diagrams can be created to give travel time, delay, and queue lengths of a road segment.

New PictureSpeed-flow
Speed – flow diagrams are to determine the speed at which the optimum flow occurs. There are currently two shapes of the speed-flow curve. The speed-flow curve also consists of two branches, the free flow and congested branches.


Source(s):

Wikipedia

Posted in earth, Education, Infrastructure | Leave a comment

A bogus reconciliation of science and religion from Nautilus

whyevolutionistrue's avatarWhy Evolution Is True

Nautilus Magazine is an online site that bills itself as “a different kind of science magazine.” And indeed it is—for it’s partly supported by the John Templeton Foundation (JTF). The Foundation is largely dedicated to showing that religion and science are compatible,—even in harmony—for Sir John left his dosh to the JTF to fund projects showing how science would reveal the divine. Thus the magazine publishes accommodationist articles, like this one from last July, and now we have a new one by Brian Gallagher, editor of the Nautilus blog Facts So Romantic and a “Sinai and Synapses” (oy!) fellow.

Here he purports to find a reconciliation of science and religion, but provides nothing of the sort. Have a read: it’s short (click on screenshot):

As we see so often, quotes are taken from Einstein and even Stephen Hawking to show that they had some simulacrum of religion, although…

View original post 808 more words

Posted in earth | Leave a comment

What our Future City will be like : A Visualisation by Shahjahan

            The city of the future is highly interconnected smart environment where people, government and business operate in symbiosis with spectacular improving technologies such as big data. The internet of things, artificial intelligence, robots, drones, autonomous green vehicles, 3D/4D printing, and renewable energy.

            Simultaneously, it is also a place where surveillance is pervasive and data capture is considered permissible by city residents.

            At their heart, smart cities are designed to capture massive amounts of data about the population and its patterns and use it to inform decision making. This information gathering results in what is called big data and it is essentially gathered via surveillance.

            It is collated from a constantly evolving and expanding internet of things – encompassing traffic lights and cameras, pollution sensors, building control systems, and personal devices all feeding giant data spheres held in the cloud. The ability to crunch all this data is becoming easier due to rampant growth in the use of devices algorithms. Artificial intelligence and predictive software.

            Here’s insight to what future cities will look like –

Autonomous, connected transport networks

            We are already noticing how technology is allowing certain companies to disrupt the transport industry. From uber with their seamless order process to testa with graner automotive alternatives, we are also seeing plenty of investment and research into the development of autonomous vehicles.

            Driverless cars are likely to be the norm in our future city. Our journey will offer a chance to catch up on work or watch your favourite shows. We won’t have to deal with the hassle of finding a place to park either, the car will drop we at our destination and find a space on its own.

            Public transport will see the biggest changes. Set routes and timetables services will be a thing of the past. Networks are connected self-driving pods will make public transport completely efficient and seamless. Simply hire a pod via app and head to your destination. Any passengers heading in the same direction will be picked up en-route.

Smart and sustainable Buildings

            Public buildings will gather data about their occupants and visitors. This will be used to ensure they operate at optimum efficient and also aid in continual improvements. This data will enable buildings to maintain an optimum temperature and ensure everyone remains safe.

The future of shopping

            High street shopping will also be the target of innovation. When you enter a clothes store, you could easily see how certain outfits would look through the use of augmented reality mirrors. The store will already know your clothes size, fashion preferences and upcoming social calendar. Clever use of artificial intelligence will enable the store to make hyper-personalized and relevant recommendations for you.

More time

            Future predictions like this are always closely followed by a debate surrounding the potential loss of jobs. It certainly is a topic that needs addressing though we believe this won’t necessarily be the case. In fact, we predict service jobs will become for more personal and quality focused. The introduction of automation will free up more time.

Other Assignments

  1. Ashna’s
  2. Sabia’s
  3. Laskar’s
  4. Shafiq’s
  5. Syed Aiyazuddin’s
  6. Wajeeha’s
  7. Toiba’s
  8. Hilal’s
  9. Heena’s
  10. Farhin’s
  11. Assma’s
  12. Sufia’s
  13. Sharda’s
  14. Noman’s
  15. Afzal’s
  16. Sadiq’s
  17. Maheen’s
  18. Juvairiya’s
  19. Mandal’s
Posted in Class Assignments M.Sc. Geography 2017-19 AMU, Aligarh, earth, urban morphology, Urban Studies | 9 Comments

Push Yourself Continuously

Orlando's avatarOrlando Espinosa

You have to keep pushing yourself out of your comfort zone. The moment you stop pushing yourself is the moment you stop growing. Continuously push yourself to be the best you!

View original post

Posted in earth | Leave a comment