Scales of Measurement

Level of measurement or scale of measure is a classification that describes the nature of information within the numbers assigned to variables. Psychologist Stanley Smith Stevens developed the best known classification with four levels, or scales, of measurement: nominal, ordinal, interval, and ratio. Other classifications include those by Chrisman and by Mosteller and Tukey.This framework of distinguishing levels of measurement originated in psychology and is widely criticized by scholars in other disciplines.

Overview

Stevens proposed his typology in a 1946 Science article titled “On the theory of scales of measurement”. In that article, Stevens claimed that all measurement in science was conducted using four different types of scales that he called “nominal,” “ordinal,” “interval,” and “ratio,” unifying both “qualitative” (which are described by his “nominal” type) and “quantitative” (to a different degree, all the rest of his scales). S. S. Stevens (1946, 1951, 1975) claimed that what counted was having an interval or ratio scale. Subsequent research has given meaning to this assertion, but given his attempts to invoke scale type ideas it is doubtful if he understood it himself … no measurement theorist I know accepts Stevens’s broad definition of measurement … in our view, the only sensible meaning for ‘rule’ is empirically testable laws about the attribute.

Nominal level

The nominal type differentiates between items or subjects based only on their names or (meta-)categories and other qualitative classifications they belong to; thus dichotomous data involves the construction of classifications as well as the classification of items. Discovery of an exception to a classification can be viewed as progress. Numbers may be used to represent the variables but the numbers do not have numerical value or relationship: For example, a Globally unique identifier.

Examples of these classifications include gender, nationality, ethnicity, language, genre, style, biological species, and form. In a university one could also use hall of affiliation as an example. Other concrete examples are

  • in grammar, the parts of speech: noun, verb, preposition, article, pronoun, etc.
  • in politics, power projection: hard power, soft power, etc.
  • in biology, the taxonomic ranks below domains: Archaea, Bacteria, and Eukarya
  • in software engineering, type of faults: specification faults, design faults, and code faults

Nominal scales were often called qualitative scales, and measurements made on qualitative scales were called qualitative data. However, the rise of qualitative research has made this usage confusing. The numbers in nominal measurement are assigned as labels and have no specific numerical value or meaning. No form of mathematical computation (+,- x etc.) may be performed on Nominal measures. Nominal level is the lowest measurement level used from a statistical point of view.

Ordinal scale


The ordinal type allows for rank order (1st, 2nd, 3rd, etc.) by which data can be sorted, but still does not allow for relativedegree of difference between them. Examples include, on one hand, dichotomous data with dichotomous (or dichotomized) values such as ‘sick’ vs. ‘healthy’ when measuring health, ‘guilty’ vs. ‘innocent’ when making judgments in courts, ‘wrong/false’ vs. ‘right/true’ when measuring truth value, and, on the other hand, non-dichotomous data consisting of a spectrum of values, such as ‘completely agree’, ‘mostly agree’, ‘mostly disagree’, ‘completely disagree’ when measuring opinion.


Interval scale

The interval type allows for the degree of difference between items, but not the ratio between them. Examples includetemperature with the Celsius scale, which has two defined points (the freezing and boiling point of water at specific conditions) and then separated into 100 intervals, date when measured from an arbitrary epoch (such as AD), percentagesuch as a percentage return on a stock, location in Cartesian coordinates, and direction measured in degrees from true or magnetic north. Ratios are not meaningful since 20 °C cannot be said to be “twice as hot” as 10 °C, nor can multiplication/division be carried out between any two dates directly. However, ratios of differences can be expressed; for example, one difference can be twice another. Interval type variables are sometimes also called “scaled variables”, but the formal mathematical term is an affine space (in this case an affine line).

Ratio scale

The ratio type takes its name from the fact that measurement is the estimation of the ratio between a magnitude of a continuous quantity and a unit magnitude of the same kind (Michell, 1997, 1999). A ratio scale possesses a meaningful (unique and non-arbitrary) zero value. Most measurement in the physical sciences and engineering is done on ratio scales. Examples include mass, length, duration, plane angle, energy and electric charge. In contrast to interval scales, ratios are now meaningful because having a non-arbitrary zero point makes it meaningful to say, for example, that one object has “twice the length” of another (= is “twice as long”). Very informally, many ratio scales can be described as specifying “how much” of something (i.e. an amount or magnitude) or “how many” (a count). The Kelvin temperature scale is a ratio scale because it has a unique, non-arbitrary zero point called absolute zero.

See This Helpful Video

Source(S):

Wikipedia
Sudy.com


Posted in earth | 2 Comments

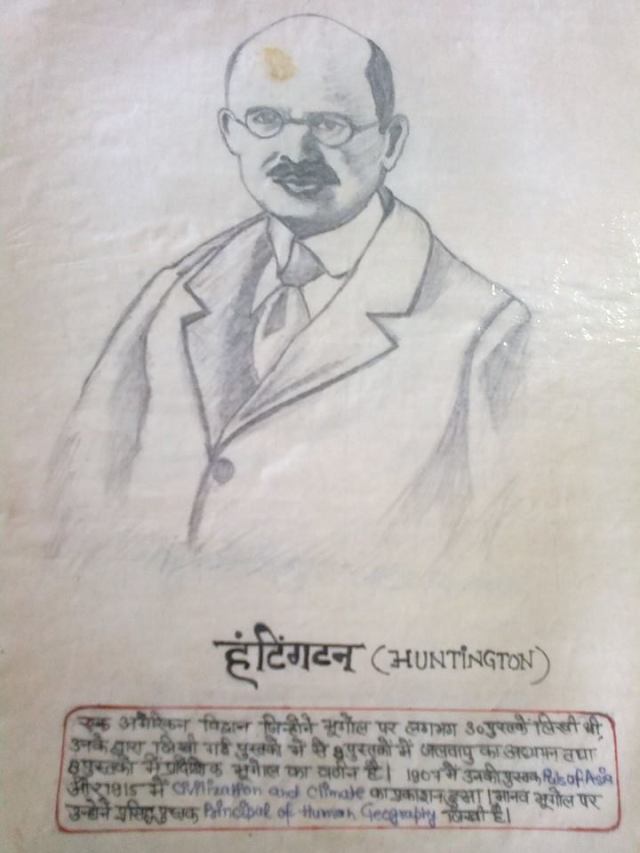
Huntington

1452479_699566696754896_753629337_nThe Sketch was sent by a student Rashid Khan.

Posted in earth, Geographers | Leave a comment

Happy Sir Syed Day Aligs : Complete Nazm of Majaz Titled “nazr-e-aligarh”- Abridged and Adopted as AMU Tarana

This is the complete nazm of majaz titled “nazr-e-aligarh” written in 1936. it was later abridged and adopted as the lyrics of AMU tarana.
ye mera chaman hai mera chaman, main apne chaman ka bulbul hun
sarshaar-e-nigaah-e-nargis hun, paa-bastaa-e-gesu-e-sumbul hun

(chaman : garden; bulbul : nightingale; sarshaar : overflowing, soaked; nigaah : sight; nargis :flower, narcissus; paa-bastaa : embedded; gesuu : tresses; sumbul : a plant of sweet odor)


har aan yahan sehbaa-e-kuhan ek saaghar-e-nau men dhalti hai

kalion se husn tapaktaa hai, phoolon se javaani ubalti hai


(sehbaa-e-kuhan : old wine; saaghar-e-nau : new goblet)

jo taaq-e-haram men roshan hai, vo shamaa yahaan bhi jalti hai

is dasht ke goshe-goshe se, ek joo-e-hayaat ubalti hai


(taaq-e-haram : vault in the sacred territory of mecca; roshan : glowing; shamaa : flame; dasht : wilderness, desert; goshaa : corner; juu-e-hayaat : stream of life)


islam ke is but-khaane men asnaam bhi hain aur aazaar bhi

tahzib ke is mai-khaane men shamshir bhi hai aur saaghar bhi


(but-khaanaa : temple; asnaam : idols; aazaar : abraham’s father, an idol-worshipper; tahziib : culture; shamshiir : sword; saaghar : wine goblet)


yaan husn ki barq chamakti hai, yaan noor ki baarish hoti hai

har aah yahaan ek naghmaa hai, har ashk yahaan ek moti hai


(barq : lightening; nuur : light)


har shaam hai shaam-e-misr yahaan, har shab hai shab-e-sheeraz yahaan

hai saare jahaan ka soz yahaan aur saare jahaan kaa saaz yahaan


(shaam-e-misr : evenings of egpyt; shab-e-sheeraz : nights of sheeraz, a famous city of iran; soz : pain)


ye dasht-e-junun deevanon kaa, ye bazm-e-vafa parvaanon ki
ye shahr-e-tarab roomaanon kaa, ye khuld-e-bareen armanon ki


(dasht : desert, wilderness; junuun : frenzy; bazm : gathering; vafaa : faithfulness; shahr-e-tarab : city of mirth; khuld-e-bariin : sublime paradise; armaan : hope)
fitrat ne sikhaee hai ham ko, uftaad yahaan parvaaz yahaangaaye hain vafaa ke geet yahaan, chheraa hai junun kaa saaz yahaan

(fitrat : nature; uftaad : beginning of life; parvaaz : flight; saaz : song on an instrument)
is farsh se hamne ud ud kar aflaak ke taare tode hainnaheed se ki hai sargoshi, parveen se rishte jore hain

(farsh : base; aflaak : heavens; nahiid : venus; parviin : 
pleiades)


is bazm men teghen khencheen hain, is bazm men saghar tode hain

is bazm men aankh bichaa’ee hai, is bazm men dil tak jore hain


(tegh : swords; saghar : goblet)


is bazm men neze khenche hain, is bazm men khanjar choome hain
is bazm men gir-gir tadpe hain, is bazm men pee kar jhoome hain

(neze : spears; khanjar : dagger; bazm : gathering)


aa aa kar hazaaron baar yahaan khud aag bhi hamne lagaayee hai
phir saare jahaan ne dekhaa hai ye aag hameen ne bujha’ee haiyaan ham ne kamanden daali hain, yaan hamne shab-khoon maare hain
yaan ham ne qabaayen nochee hain, yaan hamne taaj utaare hain


(kamand : a noose; shab-khoon : night raids; qabaayen : dress)


har aah hai khud taaseer yahaan, har khvaab hai khud taabeer yahaan
tadbeer ke paa-e-sangin per jhuk jaati hai taqdeer yahaan


(aah : sigh; taaeer : effect; taabeer : interpretation; tadbeer : forethought; paa-e-sangiin : firm footing; taqdeer : destiny)


zarraat kaa bosaa lene ko, sau baar jhukaa aakaash yahaan

khud aankh se ham ne dekhi hai, baatil ki shikast-e-faash yahaan


(zarraat : dust; bosaa : kiss; baatil : evil; shikast-e-faash: clear defeat)
is gul-kadah paarinaa men phir aag bharakne vaali hai
phir abr garajne vaale hain, phir barq karakne vaali hai

(gul-kadah : garden; pariinaa : ancient; abr : cloud; barq : lightening)


jo abr yahaan se uththega, vo saare jahaan par barsegaa
har juu-e-ravaan par barsegaa, har koh-e-garaan par barsegaa


(abr : cloud; juu-e-ravaan : flowing streams; koh-e-garaan : big mountains)


har sard-o-saman par barsegaa, har dasht-o-daman par barsegaa
khud apne chaman par barsegaa, ghairon ke chaman par barsegaa


(sard-o-saman : open and shelter; dasht-o-daman : wild and subdued; qasr-e-tarab : citadel of joy)


har shahr-e-tarab par garjegaa, har qasr-e-tarab par kadkegaa

ye abr hameshaa barsaa hai, ye abr hameshaa barsegaa


(shahr-e-tarab : city of joy; qasr-e-tarab : citadel of joy)

Keats of Indian Poetry .Asrar-ul-Haq Majaz, attended the University between 1930 and 1936. It was 1936 when he penned his famous poem Nazr-e-Aligarh. Majaz first recited it the same year in the Union Hall, in the presence of the Pro-Vice Chancellor (PVC) A.B. Ahmed Haleem. Haleem stopped the recital when Majaz reached the lines “YahaaN ham ne kamandeN daalii haiN, Yahan hum ney shabkhooN (night raids) maaray haiN; YahaN hum nay qabaayeN nochii haiN, yahan hum nay taaj utaarey haiN” (Trans: We have scaled buildings here and ambushed here, We have torn garments here and removed crowns here), and walked out. The huge gathering of students asked him to continue but Majaz did not. He had to relent later, and completed it in the Union Hall’s lawns (between Morrison court and Union building).

Although Majaz left the university campus, his poetry continued to influence students. Ishtiaque Ahmad Khan, a student of BEd (1954-55) was also one such person. An address by the VC, Dr Zakir Husain, to the final year students inspired Khan to do something long-lasting for the university. He thought of putting Majaz’s Nazr-e-Aligarh to tune and was confident of it becoming the university song.

Khan created the tune in the last week of September, 1954, and requested the President of the Union, Ahmad Saeed, for his permission to present it to the University. He refused angrily on hearing the poet’s name – Majaz being a progressive writer. But, the VC agreed and even acknowledged that it was one of Majaz’s better work.

It was October 17th, 1954, when Istiaque Ahmad Khan walked to the dais in the Stretchy Hall along with his troupe (Saleh Naiyyar, Ghulam Haider Ejaz and Fasih). Izzat Yaar Khan, Secretary of SS Hall Music Club, started the tune on the harmonium and soon the hall was reverberating with the sound of “Ye mera chaman…” The VC was impressed. Even Saeed appreciated the poem and apologised to Ishtiaque about his stand earlier.

And so the Aligarh tarana came into being. Majaz died a year after it was first played. A poetic justice indeed!

Original Nazm of Majaz


Tarana


Lubna Saleem on Majaz


Documentary on Founder 


Source(s): Click
Posted in earth | 1 Comment

Cross Tabulation in Geographical Research


Cross tabulation is a tool that allows you compare the relationship between two variables.

Defining Cross Tabulation

We can do this by an example:

Suppose that you are hired by the local school  to conduct a survey on attitudes toward environmental education. The district is planning to modify its current environmental education curriculum, but it needs additional data to help determine what to include in the curriculum. Some of the school board members think that environmental education should focus solely on awareness, while others believe that environmental education should be more comprehensive. You create a 3-item survey. The items are:

  1. Do you think that high school students should be provided with awareness only environmental education?
  2. Do you think that high schools should provide more comprehensive environmental education that includes a detailed to do list?
  3. Do you think that receiving environmental education in high school is important?

You decide to give your survey to 250 students, 250 parents and all of the 100 teachers in the school .

You decide to compare the responses of the students, parents and teachers to each other on each of the three items. The best way for you to conduct the comparisons is to use cross tabulation.

So, what is cross tabulation? Cross tabulation is a statistical tool that is used to analyze categorical data. Categorical data is data or variables that are separated into different categories that are mutually exclusive from one another. An example of categorical data is eye color. Your eye color can be divided into ‘categories’ (i.e., blue, brown, green), and it is impossible for eye color to belong to more than one category (i.e., color).

Examples of Cross Tabulation

Cross tabulation helps you understand how two different variables are related to each other. For example, suppose you wanted to see if there is a relationship between the gender of the survey responder and if environmental education in high school is important.

Using the survey data, you can count the number of males and females who said that environmental education is important, and the number of males and females who said that environmental education is not important. You then take this information and create a contingency table, which displays the frequency of each of the variables. Suppose that there are 300 females and 300 males who completed the survey. Here is what our cross tabulation looks like:

Is there a relationship between gender and if environmental   education in high school is important? If you look at the responses, you can see that almost all of the males believe that environmental education in high school is important. Although the majority of females believe that environmental education is important, the difference is not as big as between the males. From this analysis, we can conclude that males are more likely than females to believe that environmental education in high school is important.

Benefits of Using Cross Tabulations in Survey Analysis

When conducting survey analysis, cross tabulations  are a quantitative research method appropriate for analyzing the relationship between two or more variables. Cross tabulations provide a way of analyzing and comparing the results for one or more variables with the results of another (or others). The axes of the table may be specified as being just one variable or formed from a number of variables. The resulting table will have as many rows and columns as there are codes in the corresponding axis specification.

In many research reports, survey results are presented in aggregate only – meaning, the data tables are based on the entire group of survey respondents. Cross tabulations are simply data tables that present the results of the entire group of respondents as well as results from sub-groups of survey respondents. Cross tabulations enable you to examine relationships within the data that might not be readily apparent when analyzing total survey responses.

Watch this video about reading Cross Tabs

Cross Tabulation and Chi-Square

We can use Cross Tabulation and Chi-Square for data that are categorized by one or more categorical variables. With a cross tabulation and chi-square analysis, you can do the following:

  • Determine the counts or percentages for combinations of categories across two or more categorical variables.
  • Investigate the relationship between variables.

A cross tabulation displays the joint frequency of data values based on two or more categorical variables. The joint frequency data can be analyzed with the chi-square statistic to evaluate whether the variables are associated or independent. Cross tabulation analysis is used for two-way tables and is also known as contingency table analysis.

Source(s):

https://www.snapsurveys.com/blog/benefits-cross-tabulations-survey-analysis/

http://study.com/academy/lesson/cross-tabulation-definition-examples-quiz.html

http://support.minitab.com/en-us/minitab-express/1/help-and-how-to/basic-statistics/tables/cross-tabulation-and-chi-square/before-you-start/overview/


Posted in Class Notes, earth, Geography Practicals/Lab and Statistical Techniques | 1 Comment