Von Thunen Model of Land Use Around a Central Town

 Johann Heinrich von Thünen´s (1783-1850) model of agricultural land from the first half of the 19th century is considered the first ever location model. Von Thünen observed the distribution of various agricultural activities in space and, using the general assumptions of perfect competition, formulated the model of crops distribution (Ivanička, 1987). Von Thünen was convinced that the agricultural market  has a limited reach, dependent on the distance from the source – i.e. transportation costs. He observed that particular activities were focused in certain zones around the center – ideally, this would then lead to a system of concentric rings with every ring specializing in different agricultural activities  based on transportation costs, weight and perishability.

Bases

  • Transportation Costs
  • Weight
  • Perishability

Assumptions

1.There is only one market available, self-sufficient with no outside influence.

2.All farmers are market oriented, producing goods for sale. (Not subsistence.)

3.The physical environment is uniform; there are no rivers or mountains.

4.All points at equal distances from the market have equal access to the market.

5.All farmers act to maximize profits.

6.The dietary preferences of the population are those of Germanic Europeans.


The Model
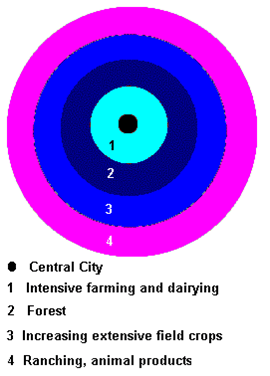
Picture1

There are four rings:

The first ring around the market community is dedicated to market gardening and fresh milk production. That is because milk products and garden crops, such as lettuce, spoil quickly. Remember that at the time von Thünen developed this model, there was not refrigeration. Therefore, it was necessary to get perishable produce to the market immediately. Because of this, producers of perishable crops were willing to outbid producers of less perishable crops in order to gain access to the land closest to the market. This means that land close to the community created a higher level of economic rent.

The second ring, von Thünen believed, would be dedicated to the production and harvest of forest products. This was because, in the early 19th century, people used wood for building, cooking, and heating. Wood is bulky and heavy and therefore difficult to transport. Still, it is not nearly as perishable as milk or fresh vegetables. For those reasons, von Thünen reasoned that wood producers would bid more for the second ring of land around the market center than all other producers of food and fiber, except for those engaged in the production of milk and fresh vegetables.

The third ring, von Thünen believed, is dedicated to crop rotation systems. In his time, rye was the most important cash grain crop. Inside the third ring, however, von Thünen believed there would be differences in the intensity of cultivation. Because the cost of gaining access to the land (rent) drops with distance from the city, those farming at the other edges of the ring would find that increased transportation costs would be offset by lower rents. Moreover, because those farming the outer edges would pay less rent, the level of input they could invest prior to reaching the point of decreasing marginal returns (the term “marginal returns” refers to changes in production relative to changes in input), would be at a lower level than would be the case for those paying higher rent in order to be closer to the market. Therefore, they would not farm as intensely as those working land closer to the urban center.

The fourth ring is dedicated to livestock ranching. Von Thünen reasoned that unlike perishable or bulky items, animals could be walked to the market. Additionally, products such as wool, hide, horn, and so on could be transported easily without concern about spoilage.

In von Thünen’s model, wilderness bounded the outer margins of von Thünen’s isolated state. These lands, he argued, would eventually develop rent value, as the population of the state increased.


Location Rent

Even though von Thünen managed to eliminate almost all the variables except distance, his transportation costs also included the bulk, weight, and perishability of the commodities moved from the rural area to the market. Moreover, it was through rent that transportation costs influenced the spatial patterns of land use.

According to this model, the spatial patterns of agricultural production are the result of competitive bidding among various rural land uses for access to a given parcel. Accordingly, the type of production that can yield the highest return for a given parcel of land will bring the highest bid for the use of that plot. Land uses that cannot pay enough to get the highest price land will settle on less expensive land. It is the net return (income minus expenses) per unit of land upon which rent calculations are based, not the value of any unit of weight or volume.

Von Thunen Model for Economic Rent

Figure 5.1: Von Thünen Model for Location Rent.
Credit: Drawn by George van Otten and Dennis Bellafiore

In von Thünen’s model, rent was not the amount actually paid by a tenant for the use of property belonging to someone else (contract rent). Instead, von Thünen was interested in location rent. In von Thünen’s model the only variable is distance.

ECONOMIC RENT:

The theory of economic rent was first postulated by David Ricardo (1772-1823), a British economist. Economic Rent differs from contract rent (the price an individual pays to use a parcel of land) in that it is a relative measure of the advantage one parcel of land has over another for a given use. Factors such as the productivity of the land relative to a given use, and distance from the market, must be considered in the calculation of economic rent. That is why the most productive land (all else equal) is always brought into production first. Of course, new space and time adjusting technologies (and/or farm technologies) affect economic rent. In short, economic rent is the surplus income that accrues to a unit of land above the amount required to bring a new unit of land into use (e.g., clearing the land, building a road, etc.).


Source(s):

https://www.e-education.psu.edu/geog597i_02/node/7


Posted in Class Notes, earth, Urban Studies | 3 Comments

Indus Valley Civilization: Extent and Archaeological Finds

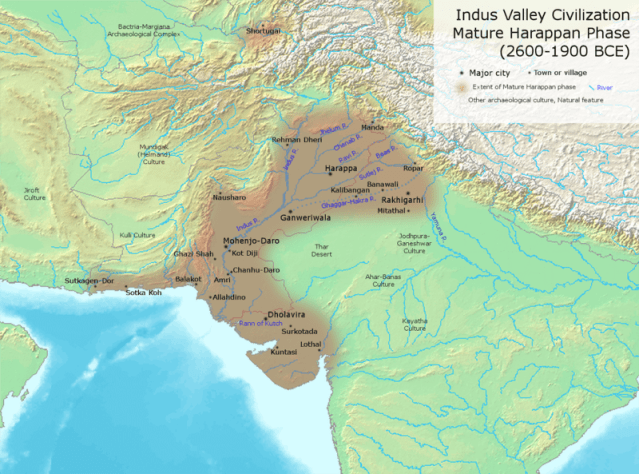
indus-valley-sites-evidencesThe Indus Valley Civilization covered parts of Sind, Baluchistan, Afganistan, West Punjab, Gujarat, Uttar Pradesh, Haryana, Rajasthan, Jammu and Kashmir, Punjab and Maharashtra. Over 1000 Indus Valley Civilization sites have been discovered.

Harappa

  1. Cemetery H & R37.
  2. Coffin burial.
  3. Granary outside the fort.
  4. Phallus worship.
  5. Mother goddess.

Mohenjo-Daro

  1. Prepared Garments.
  2. Temple like Palace.
  3. Pashupati seal.
  4. Statue of a dancing girl.
  5. Ivory weight balance.
  6. The Great Bath.
  7. The Great Granary.
  8. Priest king statue.

Kalibangan

  1. Lower fortified town.
  2. Fire Altar.
  3. Boustrophedon style.
  4. Wooden drainage.
  5. Copper ox.
  6. Evidence of earthquake.
  7. Wooden plough.
  8. Camel’s bone.

Lothal

  1. Port Town.
  2. Evidence of Rice.
  3. Fire Altar..
  4. Ivory weight balance.
  5. Copper dog.

Rangpur

  1. Evidence of Rice.

Surkotada

  1. Horse bone.
  2. Stone covered grave.

Malavan

  1. Canals

Chanhudaro

  1. Bangle factory.
  2. Ink pot.
  3. Only city without citadel.
  4. Carts with seated driver.

Balakot

  1. Bangle factory.

Daimabad

  1. Bronze Buffalo.

Amri

  1. Actual remains of Rhinoceros.

Alamgirpur

  1. Impression of cloth on a trough.

Ropar

  1. Buildings made of stone and soil.
  2. Dog buried with humans.
  3. One inscribed steatite seal with typical Indus pictographs.
  4. Oval pit burials.

Banawali

  1. Oval shaped settlement.
  2. Only city with radial streets.
  3. Toy plough.
  4. Largest number of barley grains.

Dholavira

  1. Only site to be divided into three parts.
  2. Giant water reservoir.
  3. Unique water harnessing system.
  4. Dams
  5. Embankments
  6. A stadium.
  7. Rock – cut architecture.

Source(s):

Clear IAS

Posted in Alternative Energy, Archaeology, Class Notes, earth, Glimpses of Our Cities, urban morphology, Urban Studies | Leave a comment

Happy Sir Syed Day: Hindi Transcript of Complete Nazm of Majaz Titled “nazr-e-aligarh”- Later Abridged and Adopted as AMU Tarana

22389b38-e37b-4d5f-b40d-77afac92c22a.jpgये मेरा चमन है मेरा चमन, मैं अपने चमन का बुलबुल हूँ
सरशार-ए-निगाह-ए-नरगिस हूँ, पा-बास्ता-ए-गेसू-संबल हूँ

हर आन यहाँ सेहबा-ए-कुहन एक साघर-ए-नौ में ढलती है
कलियों से हुस्न टपकता है, फूलों से जवानी उबलती है

जो ताक-ए-हरम में रोशन है, वो शमा यहाँ भी जलती है
इस दश्त के गोशे-गोशे से, एक जू-ए-हयात उबलती है

इसलाम के इस बुत-खाने में अस्नाम भी हैं और आज़ार भी
तहज़ीब के इस मै-खाने में शमशीर भी है और साघार भी

याँ हुस्न की बर्क चमकती है, याँ नूर की बारिश होती है
हर आह यहाँ एक नग्मा है, हर अश्क यहाँ एक मोती है

हर शाम है शाम-ए-मिस्र यहाँ, हर शब है शब-ए-शीराज़ यहाँ
है सारे जहाँ का सोज़ यहाँ और सारे जहाँ का साज़ यहाँ

ये दश्त-ए-जुनूँ दीवानों का, ये बज़्म-ए-वफा परवानों की
ये शहर-ए-तरब रूमानों का, ये खुल्द-ए-बरीं अरमानों की

फितरत ने सिखाई है हम को, उफ्ताद यहाँ परवाज़ यहाँ
गाये हैं वफा के गीत यहाँ, चेहरा है जुनूँ का साज़ यहाँ

इस फर्श से हमने उड़ उड़ कर अफ्लाक के तारे तोड़े हैं
नहीद से की है सरगोशी, परवीन से रिश्ते जोडें हैं

इस बज़्म में तेघें खेंचीं हैं, इस बज़्म में साघर तोड़े हैं
इस बज़्म में आँख बिछाई है, इस बज़्म में दिल तक जोड़े हैं

इस बज़्म में नेज़े खेंचे हैं, इस बज़्म में खंजर चूमे हैं
इस बज़्म में गिर-गिर तड़पे हैं, इस बज़्म में पी कर झूमे हैं

आ आ कर हजारों बार यहाँ खुद आग भी हमने लगाई है
फिर सारे जहाँ ने देखा है येह आग हमीं ने बुझाई है

यहाँ हम ने कमनदेँ डाली हैं, यहाँ हमने शब-खूँ मारे हैं
यहाँ हम ने कबायें नोची हैं, यहाँ हमने ताज़ उतारे हैं

हर आह है खुद तासीर यहाँ, हर ख़्वाब है खुद ताबीर यहाँ
तदबीर के पा-ए-संगीं पर झुक जाती है तकदीर यहाँ

ज़र्रात का बोसा लेने को, सौ बार झुका आकाश यहाँ
खुद आँख से हम ने देखी है, बातिल की शिकस्त-ए-फाश यहाँ

इस गुल-कदह पारीना में फिर आग भड़कने वाली है
फिर अब्र गरजने वाले हैं, फिर बर्क कड़कने वाली है

जो अब्र यहाँ से उट्ठेगा, वो सारे जहाँ पर बरसेगा
हर जू-ए-रवान पर बरसेगा, हर को-ए-गराँ पर बरसेगा

हर सर्द-ओ-समन पर बरसेगा, हर दश्त-ओ-दमन पर बरसेगा
खुद अपने चमन पर बरसेगा, गैरों के चमन पर बरसेगा

हर शहर-ए-तरब पर गुजरेगा, हर कसर-ए-तरब पर कड़केगा
ये अब्र हमेशा बरसा है, ये अब्र हमेशा बरसेगा

Source(s) and Link(s):

Are We Following  Syed’s Vision?

here english text can be seen

Posted in earth | 1 Comment

Functional Classification of Cities

The structure and functions of any region varies in terms of function, history of development as well as age of the town. Some towns and cities specialize in some functions and they are known for some  products or services. However, each town performs a number of functions. On the basis of functions, Indian cities and towns can be broadly into – Administrative towns and cities, Industrial towns, Transport Cities, Commercial towns, Mining towns, Garrison Cantonment towns, Educational towns, Religious and cultural towns, and Tourist towns.

Towns are  classified according to their dominant function. This dominant function may be trade, administration, defence or entertainment.

All towns are supposed to provide various services like health, education, municipal (water, electricity, sanitation), transportation and marketing. Therefore, it is not always  worth­while to classify urban places into a single particular function.

Here are some notable attempts classifications of cities by different scholars.

Aurousseau’s Classification:

In 1921, M. Aurousseau classified towns into six classes: administrative, defence, culture, production-towns, communication and recreation. His classification though a simple one, however, suffers from the defect of over-generalization. To classify a town into one major category, generally neglects the role of other classes.

In his classification economic activities are neglected. These are important in the sense that a town also caters for the need of people residing outside its municipal limits. Various classes of functions as suggested by Aurousseau create confusion in the sense that both functional and location characteristics are mixed; for example, under communica­tion-class group of towns performing function of ‘transfer of goods’ are put.

Towns with tidal-limit, fall-line-towns, bridgehead towns point out attribute of location in performance of their function. It is thus doubtful that such towns are exclusively communicational, and not locational. Similarly, pilgrimage centres are cultural towns, but these equally are significant in their geographical location on mountainous terrain, in valleys or on banks of rivers.

Univer­sity-town is also a misnomer because this type of adjective cannot be its function but only a single quality among its overall urban milieu. But Anuousseau’s classification marks a signif­icant stage and provides a springboard for sophisticated methods. It is actually a comprehensive scheme bringing together polygonal functional urban activities to classify urban centres.

Harris’s Classification:

Chauncy D. Harris remedied the deficiencies of the former subjective and common-sense-judgement-based classifications. He was able to identify quantitatively dominant function out of multifunctional character of cities. He used employment as well as occupational figures reduced to percentages to indicate cut-off points for urban activities varying in importance.

This classification is based on the fact that some activity-groups employ many more persons than others do. For example, USA’s 27 per cent employed persons of the total urban employment are in manufacturing, while wholesale trade has about 4 per cent. Thus, it is obvious that some functions should be assigned higher percentages than others. From analyzes, he was able to set up limits for each of his types as shown in the Table 9.1.

Criteria used by Harris in Functional Classification of Cities 

Harris’s classification suffers with some grave defects and cannot be universally viable. He used metropolitan districts as functional units because the industry-group data such as those published now were not then available when he did his research. Consequently, number of cities which were too small to have metropolitan districts were left unclassified.

Carter labelled Harris’s classification as subjective because the decisions to access or delete with a minimum number or cut-off points seem to be a personal one and were set by simple empirical means. Under the class of ‘Transport and Communications’, workers engaged in telephone and telegraph services were omitted simply on empirical grounds which was nothing more than a subjective decision.

Duncan and Reiss tried to revise the problem of functional specialization by using the lowest value of supper decline or quantile groups. This revision is advantageous in the sense that it made an allowance for the different size-classes in the classification.

Howard Nelson’s Classification:

Howard Nelson published A Service Classification o f American Cities, in 1955. Nelson used employment data in 24 industry groups for 897 urban concentrations of 10,000 or more people. The data were then arbitrarily grouped into nine major categories of service functions. For each industry group, the average proportion of the labor force engaged in that activity was determined. Most cities didn’t have average employment in a given industry; therefore, a variation from the mean existed. This was done because Nelson wanted to create a classification based on clearly stated statistical procedures. Nelson used a more statistical method than his predecessors – standard deviation. He used standard deviation to establish degrees of functional specialization in a given industry group. Nelson calculated three standard deviations above the mean of each industry group, since he was specifically concerned with higher levels of employment. This would allow for a degree of emphasis inside the overall functional specialization in a city. This research discovered many instances of geographical patterns. Manufacturing was the most common of all functions, with more than 1/5 of the 897 cities, and was located in the traditional manufacturing belt of the country. (Nelson 1955) Retail trade tended to be located more in the central portion of the country, and wasn’t present in the region dominated by manufacturing. Nelson’s method was a multi-functional approach, which is a stronger method of measuring economic levels than a simple dominant classification.

Nelson further removed the shortcomings of the classifications of those of Harris and others by using a stated procedure that could be objectively checked by other workers. He decided to base his method of classification entirely upon major industry groups as listed in the 1950 Census of Population for standard metropolitan areas, urbanized areas and urban places of 10,000 or more population. He omitted the little significance groups like agriculture and construction, and finally, arrived at the nine activity groups.

The problem of city specialization, and also the degree of specialization above the average was solved by giving margins of different degree to different size classes. He did find a definite tendency for the percentages employed in some activities vary with city size. The question – ‘When is a city specialized?’ was solved by using a statistical technique – the Standard Deviation (SD).

A city can be specialized in more than one activity and to varying degrees. Thus he showed for each city all activities that qualified for plus 1, plus 2, or plus 3 SDs above the mean. Table 9.2 indicates averages and SD in percentages for selected nine activity groups (1950) as developed by Nelson.

Link(s) and Source(s):

ArticleLibrary

Posted in Class Notes, earth, urban morphology, Urban Studies | Leave a comment