
The Gini index or Gini coefficient is a statistical measure of distribution which was developed by the Italian statistician Corrado Gini in 1912. It is used as a gauge of economic inequality, measuring income distribution among a population.
The coefficient ranges from 0 (or 0%) to 1 (or 100%), with 0 representing perfect equality and 1 representing perfect inequality. Values over 1 are not practically possible as we don’t take into account the negative incomes. (Income can be 0 at its lowest but not negative)
Thus, a country in which every resident has the same income would have an income Gini coefficient of 0. A country in which one resident earned all the income, while everyone else earned nothing, would have an income Gini coefficient of 1.
As we know now, the Gini coefficient is an important tool for analyzing income or wealth distribution within a country or region, but,Gini should not be mistaken for an absolute measurement of income or wealth.
A high-income country and a low-income one can have the same Gini coefficient, as long as incomes are distributed similarly within each country:
Turkey and the U.S. both had income Gini coefficients around 0.39–0.40 in 2016, according to the OECD, though Turkey’s GDP per person was less than half of the U.S.’s (in 2010 dollar terms).
Use of Gini index in data modelling
The Gini Coefficient or Gini Index measures the inequality among the values of a variable. Higher the value of an index, more dispersed is the data. Alternatively, the Gini coefficient can also be calculated as the half of the relative mean absolute difference.
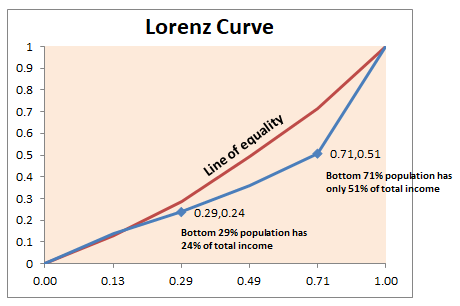
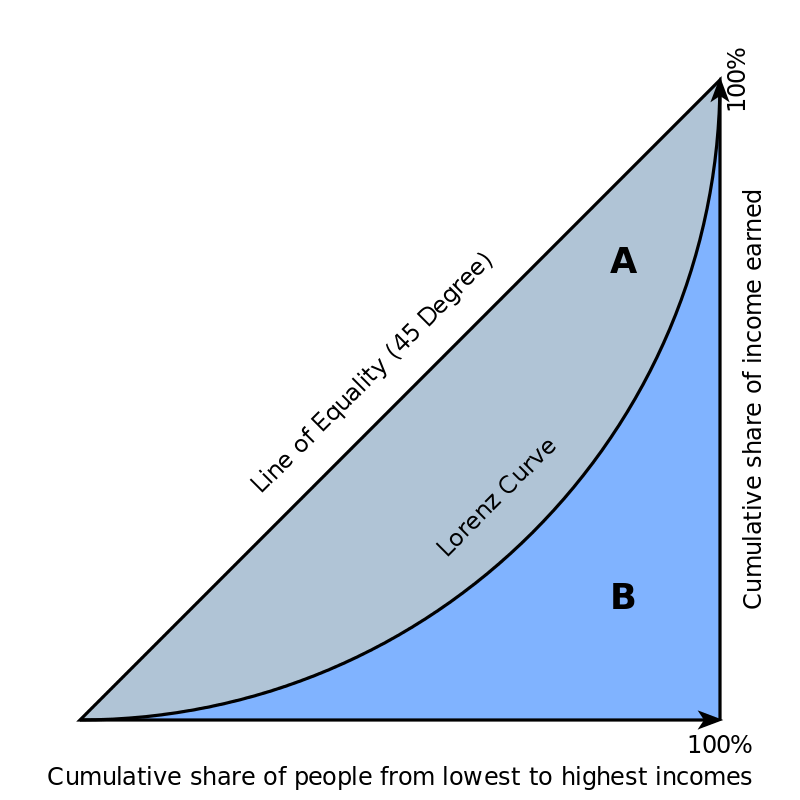
The Gini coefficient is usually defined mathematically based on the Lorenz curve, which plots the proportion of the total income of the population (y-axis) that is cumulatively earned by the bottom x% of the population.
The line at 45 degrees thus represents perfect equality of incomes.
The Gini coefficient is equal to the area below the line of perfect equality (0.5 by definition) minus the area below the Lorenz curve, divided by the area below the line of perfect equality. In other words, it is double the area between the Lorenz curve and the line of perfect equality.
Another way of thinking about the Gini coefficient is as a measure of deviation from perfect equality. The further a Lorenz curve deviates from the perfectly equal straight line (which represents a Gini coefficient of 0), the higher the Gini coefficient and the less equal the society.
Example: Following is an excel illustration of how Gini coefficient can be calculated by plotting the Lorenz curve and calculating the area between the equality line and the curve.

Source:

