
Correlation is a bivariate analysis that measures the strength of association between two variables and the direction of the relationship. In terms of the strength of relationship, the value of the correlation coefficient varies between +1 and -1. A value of ± 1 indicates a perfect degree of association between the two variables. As the correlation coefficient value goes towards 0, the relationship between the two variables will be weaker. The direction of the relationship is indicated by the sign of the coefficient; a + sign indicates a positive relationship and a – sign indicates a negative relationship. Usually, in statistics, we measure four types of correlations: Pearson correlation, Kendall rank correlation, Spearman correlation, and the Point-Biserial correlation.
Pearson r correlation: Pearson r correlation is the most widely used correlation statistic to measure the degree of the relationship between linearly related variables. For example, in the stock market, if we want to measure how two stocks are related to each other, Pearson r correlation is used to measure the degree of relationship between the two. The point-biserial correlation is conducted with the Pearson correlation formula except that one of the variables is dichotomous. The following formula is used to calculate the Pearson r correlation:
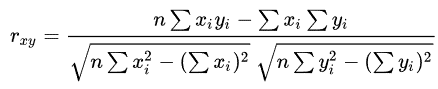
rxy = Pearson r correlation coefficient between x and y
n = number of observations
xi = value of x (for ith observation)
yi = value of y (for ith observation)
Types of research questions a Pearson correlation can examine:
Is there a statistically significant relationship between age, as measured in years, and height, measured in inches?
Is there a relationship between temperature, measured in degrees Fahrenheit, and ice cream sales, measured by income?
Is there a relationship between job satisfaction, as measured by the JSS, and income, measured in dollars?
Assumptions
For the Pearson r correlation, both variables should be normally distributed (normally distributed variables have a bell-shaped curve). Other assumptions include linearity and homoscedasticity. Linearity assumes a straight line relationship between each of the two variables and homoscedasticity assumes that data is equally distributed about the regression line.
Effect size: Cohen’s standard may be used to evaluate the correlation coefficient to determine the strength of the relationship, or the effect size. Correlation coefficients between .10 and .29 represent a small association, coefficients between .30 and .49 represent a medium association, and coefficients of .50 and above represent a large association or relationship.
Continuous data: Data that is interval or ratio level. This type of data possesses the properties of magnitude and equal intervals between adjacent units. Equal intervals between adjacent units means that there are equal amounts of the variable being measured between adjacent units on the scale. An example would be age. An increase in age from 21 to 22 would be the same as an increase in age from 60 to 61.
Kendall rank correlation: Kendall rank correlation is a non-parametric test that measures the strength of dependence between two variables. If we consider two samples, a and b, where each sample size is n, we know that the total number of pairings with a b is n(n-1)/2. The following formula is used to calculate the value of Kendall rank correlation:

Nc= number of concordant
Nd= Number of discordant
Spearman rank correlation: Spearman rank correlation is a non-parametric test that is used to measure the degree of association between two variables. The Spearman rank correlation test does not carry any assumptions about the distribution of the data and is the appropriate correlation analysis when the variables are measured on a scale that is at least ordinal.
The following formula is used to calculate the Spearman rank correlation:
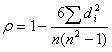
ρ= Spearman rank correlation
di= the difference between the ranks of corresponding variables
n= number of observations
Types of research questions a Spearman Correlation can examine:
Is there a statistically significant relationship between participants’ level of education (high school, bachelor’s, or graduate degree) and their starting salary?
Is there a statistically significant relationship between horse’s finishing position a race and horse’s age?
Assumptions
The assumptions of the Spearman correlation are that data must be at least ordinal and the scores on one variable must be monotonically related to the other variable.
Source:

