Hong Kong University tops in research output

India: According to a survey, Science Citations Index (SCI) Journal Publications and Citations 2002-2009 by Thomson Reuters, Land Surveying and Geo-Informatics Department of the Hong Kong Polytechnic University is at the top position with 784 citations. The university has the highest number of citations and publications per staff as well, 52.3 citations per staff and 14.1 publications per staff respectively. Geomatics Engineering Department of University of Calagary marked top position in publication category with 237 publications. Apart from these two universities, Geomatics Department of University of Melbourne; Surveying and Spatial Information Systems from University of New South Wales; Geodesy and Geomatics Engineering department of University of New Brunswick and Spatial Science Department of Curtin University of Technology also participated in this survey.
source

Posted in Uncategorized | Leave a comment

Malaria risk prediction in Afghanistan using remote sensing

Malaria is a significant public health concern in Afghanistan. Currently, approximately 60% of the population, or nearly 14 million people, live in a malaria-endemic area. Afghanistan’s diverse landscape and terrain contributes to the heterogeneous malaria prevalence across the country. According to researchers, provincial monthly malaria cases can be modelled and predicted using satellite-measured environmental parameters with reasonable accuracy. The Third Strategic Approach of the WHO EMRO Malaria Control and Elimination Plan is aimed to develop a cost-effective surveillance system that includes forecasting, early warning and detection.

Researchers used provincial malaria epidemiological data (2004-2007) collected by the health posts in 23 provinces and applied in conjunction with space-borne observations from NASA satellites. Specifically, the environmental variables, including precipitation, temperature and vegetation index measured by the Tropical Rainfall Measuring Mission and the Moderate Resolution Imaging Spectoradiometer, were used. Regression techniques were employed to model malaria cases as a function of environmental predictors.The resulting model was used for predicting malaria risks in Afghanistan. The entire time series except the last 6 months is used for training and the last 6-month data is used for prediction and validation.Vegetation index of the result reflected the fact that irrigation is the main factor that promotes malaria transmission in Afghanistan. Surface temperature is the second strongest predictor. Precipitation is not shown as a significant predictor, as it may not directly lead to higher larval population.

source

Posted in map making, Remote Sensing 101 | Leave a comment

Rivers: From Source to Sea

Rivers provide us with food, energy, recreation, transportation routes, and of course water for irrigation and for drinking. But where do they start and where do they end?

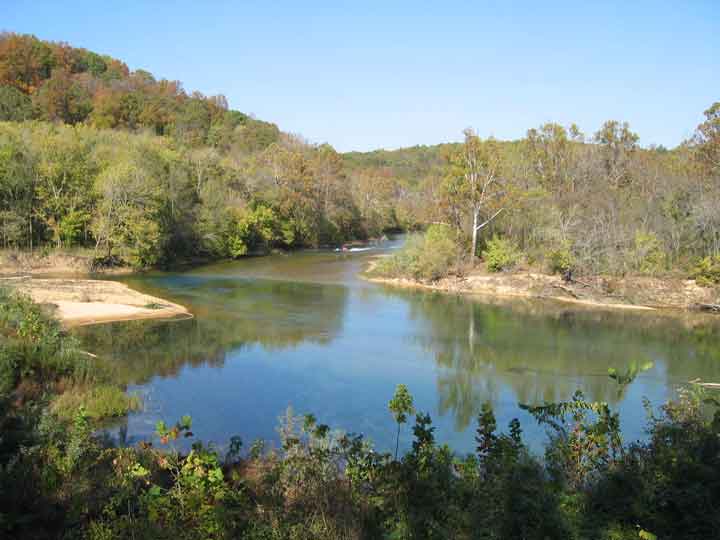
Rivers begin in mountains or hills, where rain water or snowmelt collects and forms tiny streams called gullies. Gullies either grow larger when they collect more water and become streams themselves or meet streams and add to the water already in the stream. When one stream meets another and they merge together, the smaller stream is known as a tributary. The two streams meet at a confluence. It takes many tributary streams to form a river. A river grows larger as it collects water from more tributaries. Streams usually form rivers in the higher elevations of mountains and hills.

The areas of depression between hills or mountains are known as valleys. A river in the mountains or hills will usually have a deep and steep V-shaped valley as the fast moving water cuts away at the rock as it flows downhill. The fast moving river picks up pieces of rock and carries them downstream, breaking them into smaller and smaller pieces of sediment. By carving and moving rocks, running water changes the earth’s surface even more than catastrophic events such as earthquakes or volcanoes.

Leaving the high elevations of the mountains and hills and entering the flat plains, the river slows down. Once the river slows down, the pieces of sediment have a chance to fall to the river bottom and be “deposited”. These rocks and pebbles are worn smooth and get smaller as the water continues flowing.

Most of the sediment deposition occurs in the plains. The wide and flat valley of the plains takes thousands of years to create. Here, the river flows slowly, making S-shaped curves which are known as meanders. When the river floods, the river will spread out over many miles on either side of its banks. During floods, the valley is smoothed and tiny pieces of sediment are deposited, sculpting the valley and making it even smoother and more flat. An example of a very flat and smooth river valley is the Mississippi River valley in the United States.

Eventually, a river flows into another large body of water, such as an ocean, bay, or lake. The transition between river and ocean, bay or lake is known as a delta. Most rivers have a delta, an area where the river divides into many channels and river water mixes with sea or lake water as the river water reaches the end of its journey. A famous example of a delta is where the Nile River meets the Mediterranean Sea in Egypt, called the Nile Delta.

From the mountains to the delta, a river does not just flow – it changes the surface of the earth. It cuts rocks, moves boulders, and deposits sediments, constantly attempting to carve away all of the mountains in its path. The goal of the river is to create a wide, flat valley where it can flow smoothly towards the ocean if it is not captured on the way 🙂 .

source

Posted in Rivers, water | Leave a comment

First Hole in North Pole Ice Drilled by Explorers

A group of Arctic explorers has made the grueling journey to the North Pole and drilled a hole in the ice to take the first ever sample of ocean water at the pole in an effort to better understand the impacts of climate change.The explorers, part of a group called the Catlin Arctic Survey, completed the sampling expedition after failing to last year, reported the Guardian.The team reached the geographic North Pole on May 12 after a 60-day trek across the frigid Arctic ice.

The explorers have been collecting water and marine life samples from beneath the floating sea ice during their expedition in an effort to understand how the acidification of the ocean — caused by the same accumulation of carbon dioxide in the atmosphere that is behind the planet’s warming — is impacting the polar environment. Ocean acidification occurs as the ocean absorbs excess carbon dioxide from the atmosphere, which makes the ocean more acidic and threatens organisms that have shells and skeletons made from certain minerals that dissolve in more acidic conditions, such as corals.

The team drilled their final hole of the mission (and the first hole at the North Pole) manually through the ice at the North Pole, capping off the 483-mile (777-kilometer) trek they have been on since March 14.

read original article here

Posted in climate change | Leave a comment