
Chi square or Pearson’s chi- square test, is any statistical hypothesis, which is used to determine whether there is a significant difference between expected frequencies and the observed frequencies in one or more category.
An important consideration when cross tabulating the findings of your study is verifying if what is represented in the cross-tab is true or false. This is similar to the doubt some of us would be in after joining a university questioning if this was indeed a good fit or not. To resolve this dilemma crosstab is computed along with the Chi-Square analysis which helps identify if the factors involved in the study are independent or related to each other. If the two factors are independent then the tabulation is termed insignificant and the study would be termed as null hypothesis which means that since the factors are not related to each other the outcome of the study is unreliable on the contrary if there exist a relation between the two factors that would confirm that the tabulation results are significant and can be relied on to take strategic decisions.
Another significant term that we will introduce here is “Null hypothesis”. The null hypothesis, basically assumes, any kind of difference or importance one can see in a set of data is by chance. The opposite of the null hypothesis is called the “alternative hypothesis”.
Applying chi square to surveys is usually done with these question types:
- Demographics
- Likert scale questions
- Cities
- Product name
- Dates and number (when clubbed together)
For example, we need to find out if there is any association between the buyer behavior of purchasing electronic devices and the region where it is sold then the data will be entered like the one in the table below:
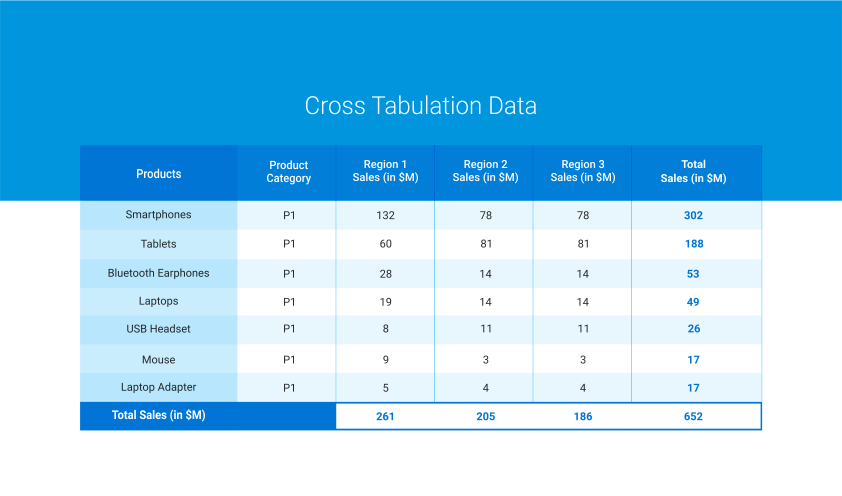
As mentioned earlier the Chi square test helps you determine if two discrete variables are associated. If there’s an association, the distribution of one variable will differ depending on the value of the second variable. But if the two variables are independent, the distribution of the first variable will be similar for all values of the second variable.
Using cross tabulation and chi square we derive the following inference:
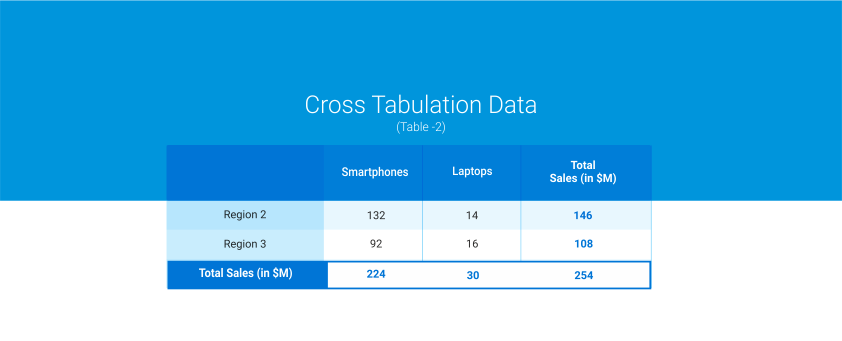
Applying the Chi square calculation to the above values:
Pearson’s chi square= 0.803, P- Value= 0.05
So what does this mean?
We need to pay attention to the p- value. Compare the p-value to your alpha-level which is commonly 0.05
- If p-value is less than or equal to alpha-value then the two variables are associated.
- If p-value is greater than alpha value, you conclude the variables are independent.
In this example Pearson chi-square statistics is 0.803 (with a p-value 0.05). So with an alpha-value of 0.05, we therefore, conclude that there is no correlation and is insignificant.
Source(s):

