Aaiyey is Sir Syed Day par eik Khamosh dua karein- Aaj Jaise AMU Campus Roshni mein Nahaya Hua hai- Aise hi Ilm ki Roshni se Mulk aur Jahan Roshan Hon- Ameen.
. Amw – यह उष्ण कटिबंधीय (मानसूनी) आर्द्र मुख्य जलवायु प्रदेश है जिसमें सबसे ठण्डे माह का तापमान 18 डीग्री सेंटीग्रेड से ऊपर रहता है तथा इसमें लघु शुष्क ऋतु भी होती है। ऐसी जलवायु भारत में कांकण एवं मालाबार तटवर्ती क्षेत्रों में पायी जाती है जिनमें गोवा दक्षिणी पश्चिमी महाराष्ट्र, पश्चिमी कर्नाटक, केरल तथा कन्याकुमारी तक फैला तमिलनाडु तट सम्मिलित है। इनके अतिरिक्त त्रिपुरा व दक्षिणी मिजोरम में भी यह जलवायु मिलती है। यहाँ शीतकाल शुष्क रहता है तथा ग्रीष्म काल एवं वर्षा काल में मानसूनी पवनों द्वारा वर्षा होती है। इस क्षेत्र में 200 से.मी. से अधिक वार्षिक वर्षा प्राप्त होती है, फलस्वरूप सदाबहार वनस्पति पायी जाती है। यह क्षेत्र सह्याद्री पर्वत का पश्चिमी भाग है, जो मानसूनी पवनों की अरब सागरीय शाखा के एकदम सामने पड़ता है तथा इसका दक्षिणी भाग मानसूनी पवनों के प्रवेश पर ही स्थित है, फलस्वरूप पर्याप्त वर्षा प्राप्त होती है तथा कर्क…
You research two groups and put them in categories single, married or divorced:
The numbers are definitely different, but …
Is that just random chance?
Or have you found something interesting?
The Chi-Square Test gives a “p” value to help you decide!
Example: “Which holiday do you prefer?”
Beach
Cruise
Men
209
280
Women
225
248
Does Gender affect Preferred Holiday?
If Gender (Man or Woman) does affect Preferred Holiday we say they are dependent.
By doing some special calculations (explained later), we come up with a “p” value:
p value is 0.132
Now, p < 0.05 is the usual test for dependence. In this case, p is greater than 0.05, so we believe the variables are independent (ie not linked together).
In other words, Men and Women probably do not have a different preference for Beach Holidays or Cruises.
Understanding “p” Value
“p” is the probability the variables are independent.
Imagine that the previous example was in fact two random samples of Men each time:
Men:
Beach 209, Cruise 280
Men:
Beach 225, Cruise 248
Is it likely you would get such different results surveying Men each time?
Well the “p” value of 0.132 says that it really could happen every so often.
Surveys are random after all. We expect slightly different results each time, right?
So most people want to see a p-value less than 0.05 before they are happy to say the results show the groups have a different response.
Let’s see another example:
Example: “Which pet do you prefer?”
Cat
Dog
Men
207
282
Women
231
242
By doing the calculations (shown later), we come up with:
P value is 0.043
In this case p < 0.05, so this result is thought of as being “significant” meaning we think the variables are not independent.
In other words, because 0.043 < 0.05 we think that Gender is linked to Pet Preference (Men and Women have different preferences for Cats and Dogs).
Just out of interest, notice that the numbers in our two examples are similar, but the resulting p-values are very different: 0.132 and 0.043. This shows how sensitive the test is!
Why p<0.05 ?
It is just a choice! Using p<0.05 is common, but we could have chosen p<0.01 to be even more sure that the groups behave differently, or any value really.
Calculating P-Value
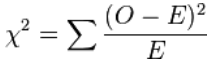
So how do we calculate this p-value? We use the Chi-Square Test!
Chi-Square Test
Note: Chi Sounds like “Hi” but with a K, so say Chi-Square like “Ki square”
And Chi is the greek letter Χ, so we can also write it Χ2
Important points before we get started:
This test only works for categorical data (data in categories), such as Gender {Men, Women} or color {Red, Yellow, Green, Blue} etc, but not numerical data such as height or weight.
The numbers must be large enough. Each entry must be 5 or more. In our example we have values such as 209, 282, etc, so we are good to go.
Our first step is to state our hypotheses:
Hypothesis: A statement that might be true, which can then be tested.
The two hypotheses are.
Gender and preference for cats or dogs are independent.
Gender and preference for cats or dogs are not independent.
Lay the data out in a table:
Cat
Dog
Men
207
282
Women
231
242
Add up rows and columns:
Cat
Dog
Men
207
282
489
Women
231
242
473
438
524
962
Calculate “Expected Value” for each entry:
Multiply each row total by each column total and divide by the overall total:
Cat
Dog
Men
489×438/962
489×524/962
489
Women
473×438/962
473×524/962
473
438
524
962
Which gives us:
Cat
Dog
Men
222.64
266.36
489
Women
215.36
257.64
473
438
524
962
Subtract expected from actual, square it, then divide by expected:
Cat
Dog
Men
(207-222.64)2222.64
(282-266.36)2266.36
489
Women
(231-215.36)2215.36
(242-257.64)2257.64
473
438
524
962
Which is:
Cat
Dog
Men
1.099
0.918
489
Women
1.136
0.949
473
438
524
962
Now add up those values:
1.099 + 0.918 + 1.136 + 0.949 = 4.102
Chi-Square is 4.102
From Chi-Square to p
To get from Chi-Square to p-value is a difficult calculation, so either look it up in a table, or use the Chi-Square Calculator.
But first you will need a “Degree of Freedom” (DF)