Environmental Destruction Brought Us COVID-19. What It Brings Next Could Be Far Worse.

Exposing the Big Game's avatarExposing the Big Game

A virus that originated in animals has upended life across the globe. But the next deadly pandemic could make this look like “a warmup.”
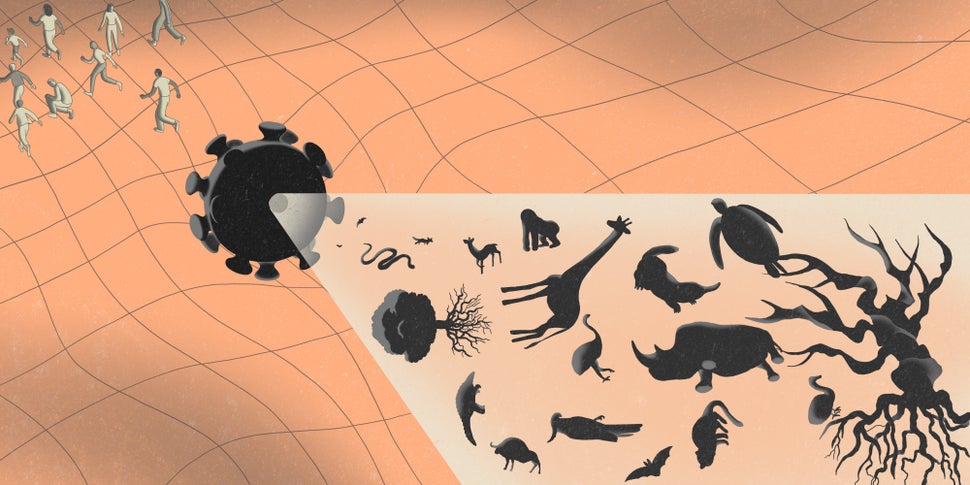
ILLUSTRATION: JUN CEN FOR HUFFPOST

Dr. Richard Kock was on duty at London’s Royal Veterinary College in January 2017 when he received an urgent message from international health officials. He was needed for an emergency response mission in the Mongolian countryside, where a deadly viral outbreak was underway.

He packed his things, caught a flight to the capital city of Ulaanbaatar and drove for two days into the arid steppe. He found a disturbing scene: frozen corpses scattered on hillsides, burn pits stacked with bodies and residents addled with anxiety.

But this pandemic was not targeting humans. It was goat plague, a lethal and highly infectious virus that has killed goats, sheep and other small ruminants in huge numbers…

View original post 3,610 more words

Posted in earth | Leave a comment

Band Graph

 It shows the trend of values, both the total and its parts, by a series of lines drawn on the same frame. The Y-axis represents the time scale and the X-axis shows the values.  The corresponding sub-division are shaded differently to form different bands.


Posted in Class Notes, earth, Geography Practicals/Lab and Statistical Techniques | Leave a comment

Coronavirus, Climate Change, and Tropical Forests

Map uses false-color satellite imagery to illustrate the varied land cover types in and around the Amazon Rainforest. Source: NASA Earth Observatory.Long before the wet markets of Wuhan became the focus of worldwide attention, scientists have pointed to tropical deforestation and habitat destruction as key factors facilitating the spread of zoonotic viruses such as Ebola…

via Coronavirus, Climate Change, and Tropical Forests — Legal Planet

Posted in earth | Leave a comment

ERGOGRAPH

This graph shows relationship between season, climate and crops. •the climate is represented by monthly average temperature, rainfall and relative humidity , which are marked along the Y- axis. •The twelve month are marked along the X-axis. Below the X- axis, the acreage of various crops is shown on some selected scale. A GEDDES and AG OGILVIE presented circular ergograph to show the continuous rhythm of seasonal activities.

Link(s) and Source(s):

Slide Share

Posted in Class Notes, earth, Geography Practicals/Lab and Statistical Techniques | Leave a comment