Urbanism is a way of life for today’s world and we largely have to live with and in cities, if not today then tomorrow. There is not a scientifically or technically correct or incorrect way of making a city. Defining what makes a good city is more a matter of heart and soul than of engineering. It is an art of knitting urban fabric. Yet, despite the subjective nature of urbanism, a government must adopt a vision and promote it, make decisions, build, define rules and enforce them – it must not only envision but also enact the city. If a good city is society’s collective work of art, then its government acts as the piece’s conductor and often its composer as well.
It is not possible to leave it up to private entrepreneurs whether there should be pavements or how wide they should be, how tall buildings should be, whether there should be parks and, if yes, where or how big they should be, and whether there should be a mixture of residential and commercial buildings. The fact that government intervention is essential, together with the reality that there are multiple possible designs for a city. City design tells us about the past and future of the city.
In actual urban environments, Adam Smith’s notion that individuals seeking their own benefit brings about the best for society as a whole is not always valid
There are at least two types of equality we can realistically strive for in our time: the first is equality in quality of life,The second kind of equality – which is still within our reach – is to make truly effective the principle that the public good must prevail over private interest. The first article in every constitution stipulates that all citizens are equal before the law. Consequently, some state explicitly that the public good must prevail over private interest. In cities the interests of a few individuals often conflict with those of the community as a whole. It is the role of politics and governmental institutions to manage those conflicts and find ways of promoting inclusion and social justice.
Our century is Urban Century. According to the United Nations, there will be nearly 2.8 billion new inhabitants in cities in developing countries over the next 40 years. It is in cities in developing countries like India that many of the core urban and environmental challenges are concentrated in this century. And issues of equality and inclusion are particularly relevant there, as their societies are highly unequal. Inequality and exclusion can be even more painful than poverty, but the way we create and organise cities may be a powerful instrument in constructing equality and social justice.
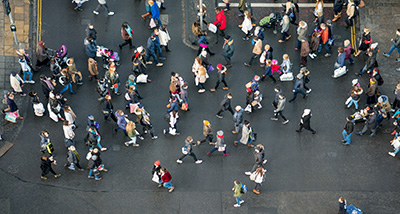
Public space dedicated to pedestrians can be a means to a more inclusive society. It ought to be democratic.During work time the highest executive and the lowest-ranking employee may be equally satisfied or dissatisfied; in public space they both meet colleagues and do their jobs. It is only during leisure time that an abyss separates their quality of life. The upper-income executive goes home to a large house, probably with a garden, has access to sports clubs, country houses, restaurants, expensive cultural activities and trips abroad. The low-income person and his or her children live in a very small dwelling and the only alternative to television for spending their leisure time is public space accessible for pedestrians.
Access to green spaces may be the most formidable barrier to inclusion. We also have to decide whether they are really good for the city.What the poor may or may not have in future is access to green spaces and sports facilities – unless governments act today. B
A protected bicycle lane in a city in a developing country is a powerful symbol, showing that a citizen on a US$ 30 bicycle is as important as one in a US$ 30,000 car. A protected bicycle lane along every street is not a cute architectural fixture, but a basic democratic right – unless one believes that only those with access to a car have a right to safe mobility. Quality pavements and bicycle lanes show respect for human dignity, regardless of the level of economic development of a society. Many citizens in economically advanced societies cannot drive, because they are too young or too old, or because they have some kind of disability.
A democratic city must be designed for the most vulnerable of its members. There is a fight for the scarce road space between cars and public transport, pedestrians and cyclists; and there is a battle for public funds between car owners demanding more road infrastructure and lower-income citizens demanding schools, sewage systems, housing, parks and other basic infrastructures. The minority of car owners usually command the most political clout and thus direct public investment to road infrastructure aimed at reducing peak-hour traffic jams, leaving the needs of the poor unattended. Both urban and rural roads ignore or take poor care of pedestrians’ and cyclists’ infrastructure needs, especially in developing countries.
In a City striving to be Democratic, Resources should be concentrated on public transport. It is the amount of infrastructure available for cars that determines the level of car use.There is no ideal mix. Granularity of the city is a must in the future city design.
In most advanced cities today transport policy strive to finding ways of achieving lower levels of car use and a higher share for public transport, cycling and walking. In cities in developing countries ‘transport policy’ still largely means the opposite: how to facilitate more car use. In societies in developing countries, where less than 50 per cent of households do not have a car, having one is held as a visible certificate of belonging to society’s higher echelons. Upper-income people in less-developed and highly unequal societies tend to see using public transport alongside lower-income citizens as an affront to their position in society. Although they gladly use public transport when they travel to more advanced countries, they rarely go near it in their own.It is imperative here that ‘Last Mile Connectivity’ has a major role play in the decision.
This partly because a city that makes too much room for fast- moving cars becomes less humane and loses quality of life, but also because road-infrastructure investments primarily benefiting higher-income citizens, redirect public funds away from schools, parks, housing and many other needs. The most vulnerable members of society, such as the poor, the elderly, children and disabled citizens, are not normally conscious of their interests and rights and do not have much political influence. A democratic government must act on their behalf and confront powerful minorities on their behalf. It must convince even upper-income groups that car-use restriction benefits them as well in the longer term. But in the end it must wield its decision-making power in order to implement its vision regardless of political costs.
A healthy, large city will have both low- and high-income groups. Blunt extraction of funds from wealthier municipalities in order to transfer them to lower-income ones does not solve the problem: it has been found that those who spend funds not generated by themselves tend to do so inefficiently. To make matters worse, poorer citizens with lower levels of education tend to be easy prey to demagogues and corrupt politicians.
While there may be historical reasons for the existence of several municipalities within one city, once they are part of a large, modern metropolitan area there is little justification for them. Most citizens cross municipal borders unaware of their boundaries, except of course when the absurdity of such political subdivision is so extreme that public transport has to turn back at the border of the municipality, as happens in São Paulo. Long-term planning also becomes complicated when such subdivisions exist. Even the construction of a critical road artery or rail line becomes problematic. When different political parties control different municipalities, more problems arise, as has been the case in Mexico City. Bureaucratic expenses of many small municipalities are higher than those of one large one, and often the level of professional competence is lower within the smaller municipalities.
For these reasons Canada has merged nearly 1,000 municipalities over the last decade, achieving more social justice, lower bureaucratic expenses and better long-term planning. In Johannesburg several municipalities were also merged after the end of the apartheid regime, in order to achieve greater equity. Higher-income citizens tend to oppose these mergers, as some of their funds will subsequently have to be redistributed to lower-income areas. Many small-town politicians also oppose them as they may end up in an unelectable position, or simply because they prefer to be, as the saying goes, the head of a mouse rather than the tail of a lion.
Innovations are always difficult to implement. The status quo is maintained through a majority support, while ideas for change start with only a minority behind them. Government must act on behalf of the majority and also of the most vulnerable members of society, but it must also act on behalf of future generations. It is not possible for governments to provide all citizens with individual goods, yet it is possible to provide quality public goods and services: schools, libraries, transport and green space. Moreover, once citizens achieve a certain income level, it is easier to increase well-being through public goods than through private goods: through a concert hall, a green area, a waterfront.
Investments in flyovers to minimise traffic jams for upper-income groups seem normal. The poor in the same city might lack schools or basic sanitation and sometimes even clean water, while private waterfronts, pavement-less streets and urban roads abound. If we were truly rigorous in applying the prevalence of the public good, cities in developing countries would ban private car use during peak hours. Only a minority would be affected. Most people’s travel would take less time and there would be less air pollution; less road building and maintenance would free up public funds for better provisions for the needs of lower-income majorities.
The way cities are built determines to a large degree citizens’ quality of life for hundreds of years into the future.
Source(s) and Link(s):