Site of a Settlement

The Site of a settlement describes the physical nature of where it is located. Factors such as water supply, building materials, quality of soil, climate, shelter and defence were all considered when settlements were first established. For instance the site of Sydney, in Australia, initially took advantage of the excellent natural harbour and surrounding fertile farmland.

Paris was established at a point where an island allowed an easier passage across the river Seine as well as providing defence, fishing, transport, and drinking water.

There are a huge number of factors that have to be considered when trying to locate a new settlement. These can be grouped into four broad headings: climatic, economic, physical and traditional. The diagram below should give you an idea of how each one plays a part in the location of a settlement.

Site Factors

Aspect

Aspect and shelter are two of the most important factors that were used when deciding where to locate a settlement. Aspect relates to the direction in which the land faces. In the Northern Hemisphere the best slopes to locate on are those that face south, as they will receive the most sunshine, and therefore be best for agriculture. This can be seen clearly in many of the valleys of the Alps, where settlements have located on the south-facing slopes.

Shelter is also very important, particularly from the cold northerly winds and prevailing south westerly winds in the UK. A good example of settlements being sheltered by their natural surroundings are the many spring-line settlements found along the base of the chalk escarpments of the North and South Downs. These settlements would also have benefited from the good water source and fertile farmland nearby.

Water supply:

A supply of water was probably the single most important factor in deciding where a settlement might be located. Not only do rivers provide a source of clean drinking water, they also provided a food source through fishing, and a transport route. Most of the world’s largest cities are located on rivers, especially the point at which they reach the sea, as this was often the first point that explorers landed.

Dry point sites:

Water is vital to a settlement and is the most common factor behind their location. A dry point site is one that is slightly raised from the surrounding area, meaning that it is less likely to flood. Ely in Cambridgeshire is a good example of this.

Wet point sites:

This refers to any site that has access to water, usually through being beside a river. Towns would either grow up along the river or clustered near the point at which the river enters the sea. Examples of wet point sites include the towns and villages of the Welsh valleys, which tend to extend along the flat valley floor, rather than up the steep valley sides. Spring line settlements in the North and South Downs are also good examples of wet point sites.

Defence:

In medieval times defence was one of the most important factors influencing the site of a settlement. The relief (shape) of the land often proved to be the best form of defence. Edinburgh castle sits on the top of a glacial crag, in an almost perfect position to defend itself, with very little chance for the attackers. In Italy, there are many walled hill-top villages, whilst the Maoris in New Zealand built their settlements (called Pa’s) on the top of steep hills to prevent being attacked.

The other common natural feature used for defence is water, and in particular rivers. Both Shrewsbury and Durham are very good examples of where a meander of the river has formed an area of land bounded by water on three sides. This provided both cities with excellent defences, as they only had a thin neck of land to defend.

Resources:

The idea of resources covers a huge number of different things. For early settlers the most important resources were fuel, building materials and food. Settlements grew in areas where wood was plentiful, stone easily accessible and good soil allowed agriculture to be developed.

Since those early days of settlement many different resources have become the focal points for the growth of urban areas. Some of these are listed below:

Mining: The coal mines of South Wales, Tin mines of Cornwall and large mining projects as seen at Carajas in Northern Brazil, have all encouraged the rapid growth of settlements aimed at housing the workers and providing them with all that they require.

Food: The farming area of East Anglia is one example of how small settlements will locate in areas conducive to good agriculture.

Oil: Settlements in Alaska and the Middle East have grown rapidly on the back of the oil industry.

Precious metals: Settlements in South Africa have grown after the discovery of large deposits of precious metals such as gold. The most famous settlement to grow due to finding gold is San Francisco, after the gold rush to California in 1849.

Route centres:

Route centres are often called Nodal Points. Anywhere where two routes meet has great potential for settlement. Often these are formed by the meeting of two valleys, but settlement nowadays will grow where two main roads meet. In the UK, York is a good example of a route centre. Birmingham also enjoys a very good location, where many routes join up, and this is one of the reasons for its growth to become one of the largest cities in the UK.

Bridging points:

Just as water is very important for drinking, fishing, irrigation and navigation, so the ability to cross the rivers is also very important.

Many towns and cities have built up at points where it was easiest to cross a large river. Exeter is one such example, crossing the river Exe.

However one of the best examples is Paris in France. The original town was based on the tiny Ile dela Cite, which is an island in the middle of the River Seine. This island meant they could build two small bridges across the river rather than one large one.

The new settlement also benefited from all the other advantages associated with being beside a river, as well as becoming a route centre due it being one of the only places to cross the river. Nowadays the island has been engulfed by the huge city that Paris has become, however it does still have many bridges going to it and is the point where the huge Notre Dame Cathedral is built.

The confluence of two rivers:

Just as two valleys, or roads, make a nodal point for settlement growth, so do two rivers joining. One such example is found in Khartoum in Sudan, where the Blue and the White Nile meet.

Situation

The situation of a settlement is the description of the settlement in relation to the other settlements and physical features around it. The situation of a settlement is the most important in determining whether it grows to become a large city or stays as a small town or village.

In the UK, Birmingham is an example of a city with an excellent situation. It is located central to the country, with excellent links by road to the North and South to London.

As cities begin to fulfil different functions their importance can increase or decrease. Their situation plays an important part in deciding which of these will occur.

Source(s) and Reading(s): 

Read More Here
Situational Siting of a Settlement

Posted in Class Notes, earth, urban morphology, Urban Studies | Leave a comment

Defining Spatial Data

Geographic position refers to the fact that each feature has a location that must be specified in a unique way. To specify the position in an absolute way a coordinate system is used. For small areas, the simplest coordinate system is the regular square grid. For larger areas, certain approved cartographic projections are commonly used. Internationally there are many different coordinate systems in use. This Locational information is provided in maps by using Points, Lines and Polygons.These geometric descriptions are the basic data elements of a map. Thus spatial data describes the absolute and relative location of geographic features.

The coordinate location of a forest would be spatial data, while the characteristics of that forest, e.g. cover group, dominant species, crown closure, height, etc., would be attribute data. Other data types, in particular image and multimedia data, have become more prevalent with changing technology. Depending on the specific content of the data, image data may be considered either spatial, e.g. photographs, animation, movies, etc., or attribute, e.g. sound, descriptions, narration’s, etc.

Generally speaking, spatial data represents the location, size and shape of an object on planet Earth such as a building, lake, mountain or township. Spatial data may also include attributes that provide more information about the entity that is being represented. Geographic Information Systems (GIS) or other specialized software applications can be used to access, visualize, manipulate and analyze geospatial data.

A common example of spatial data can be seen in a road map. A road map is a two-dimensional object that contains points, lines, and polygons that can represent cities, roads, and political boundaries such as states or provinces. A road map is a visualization of geographic information. The location of cities, roads, and political boundaries that exist on the surface of the Earth are projected onto a two-dimensional display or piece of paper, preserving the relative positions and relative distances of the rendered objects.

The data that indicates the Earth location (such as longitude and latitude) of these rendered objects is the spatial data. When the map is rendered, this spatial data is used to project the locations of the objects on a two-dimensional piece of paper. A GIS is often used to store, retrieve, and render this Earth-relative spatial data.

Types of spatial data (other than GIS data) that can be stored using Spatial and Graph include data from computer-aided design (CAD) and computer-aided manufacturing (CAM) systems.

The differences among these systems are in the size and precision of the data, not the data’s complexity. The systems might all involve the same number of data points. On a geographic scale, the location of a bridge can vary by a few tenths of an inch without causing any noticeable problems to the road builders, whereas if the diameter of an engine’s pistons is off by a few tenths of an inch, the engine will not run.

These applications all store, retrieve, update, or query some collection of features that have both nonspatial and spatial attributes. Examples of nonspatial attributes are name, soil_type, landuse_classification, and part_number. The spatial attribute is a coordinate geometry, or vector-based representation of the shape of the feature.

Source(s):

Oracle

TechTarget

Posted in earth, Geography Practicals/Lab and Statistical Techniques | Leave a comment

Do cities increase Rich-Poor Gap?

Do cities increase rich-poor gap? It is seen that there is more equality in cities as world economic forum suggests.

Several explanations for increasing income inequality have been proposed, including skill-biased technological change brought about by computers and modern telecommunications, the expansion of global goods and labour markets, and changes in countries’ skill and age distributions. Yet one pattern has gone largely unnoticed: inequality is especially strong in large cities.

In an age in which virtually all countries in the world are simultaneously experiencing unprecedented urbanization and sharply rising earnings inequality, the question of a link between the two patterns arises naturally. Are big cities merely the locus where income inequality is starkest, or are they host to economic mechanisms that explain (at least partly) that inequality?

Inequality and large cities

Large cities are more unequal than the nations that host them. For example, income inequality in the New York Metro Area (MSA) is considerably higher than the US average and similar to that of Rwanda or Costa Rica. Large cities are also more unequal than smaller towns. Figure 1 plots the relationship between population size and the Gini index of income inequality for a 2007 cross-section of US MSAs (solid line). The relationship is clearly positive. This holds true even when considering that large cities host more educated people on average (dashed line); income inequality cannot be entirely explained by higher educational attainment in large cities.

How can we then explain the size-inequality nexus? Researchers have proposed two main explanations so far, both of which have to do with city composition.

First, large cities may differ systematically in their industrial structure and the functions they perform. Large cities host, for example, more business services and the higher-order functions of finance and research and development (R&D), whereas small and medium-size cities host larger shares of lower-order services and manufacturing. Consequently, larger cities are more skilled. However, industry composition explains only about one-fifth of the observed skill variation across cities (Hendricks 2011). Furthermore, that variation cannot fully account for observed income inequality.

Second, large cities attract a disproportionate fraction of households at the bottom and at the top of the income distribution (Eeckhout et al 2014). Central cities of US MSAs attract, for example, poor households because they offer better access to public transportation (Glaeser et al. 2008). Large cities also attract rich households because they reward their skills more highly than smaller cities – a “superstar effect” in “superstar cities” (Behrens et al. 2014, Gyourko et al. 2013, Rosen 1981).

Superstars and ‘survival of the fittest’

The theory also predicts that increasing globalization among the world’s cities will translate into larger urban income inequality. Just as large cities provide large local markets to reward skills, larger global markets serve the same function. One novel aspect of our analysis is to emphasize the existence of both a direct effect of increasing globalization on inequality (the superstar effect) and an indirect effect that goes through increasing urbanization and the growth of cities. Cities are more valuable in a globalized world, which may serve to explain increasing urbanization. The latter is positively linked to inequality, an aspect that has not been much analysed until now.

Urban winners take all: should we care?

What are the possible implications of our theory for public policy? The first motivation for our research is that cities are the correct spatial scale for looking at inequality. The reason is also sociological: people perceive inequality more strongly when they see it at close range. The spatial proximity of favelas and modern football stadiums in Brazil offers a striking contrast and has been hotly debated.

Second, as argued above, cities are not only where inequality materializes, but they are also hosts to mechanisms that contribute to changes in that inequality. As such, focusing on cities is of primary interest when it comes to designing policies that aim at reducing inequality and its adverse social effects.

Conclusions

Here is the  conclusion with two words of caution. First, nominal income inequality (which is measured) is not equivalent to real income inequality (which is not directly measurable). Insofar as large cities offer a wider range of cheaper goods and services than small cities do, and if this pattern is especially pronounced for the least well off, then actual real urban inequality may be less severe than nominal inequality (Handbury and Weinstein 2011). Actually, Harvard economist Edward Glaeser claims that the large poverty rates of central cities are a testimony of their success, not their failure: they attract poor households by catering better to their needs (Glaeser 2011).

Second, fighting urban inequality does not require aggressive local redistributive policies, for such policies attract the poor and repulse the rich, leading to the bankruptcy of local governments, such as the fiscal crisis that hit New York City in the 1970s. State-wide or nationwide policy coordination is required.

Urban Poverty and rural poverty differs structurally. While urban poverty is mainly because of rich-poor gap and reflects in some specific residential area rural poverty is ingrained in societal structure.

Source(s):

World Economic Forum

Urban Poor, UN and Slums

Social Exclusion

Magnets of Social exclusion

Posted in earth | Leave a comment

Shifting Prime Meridian

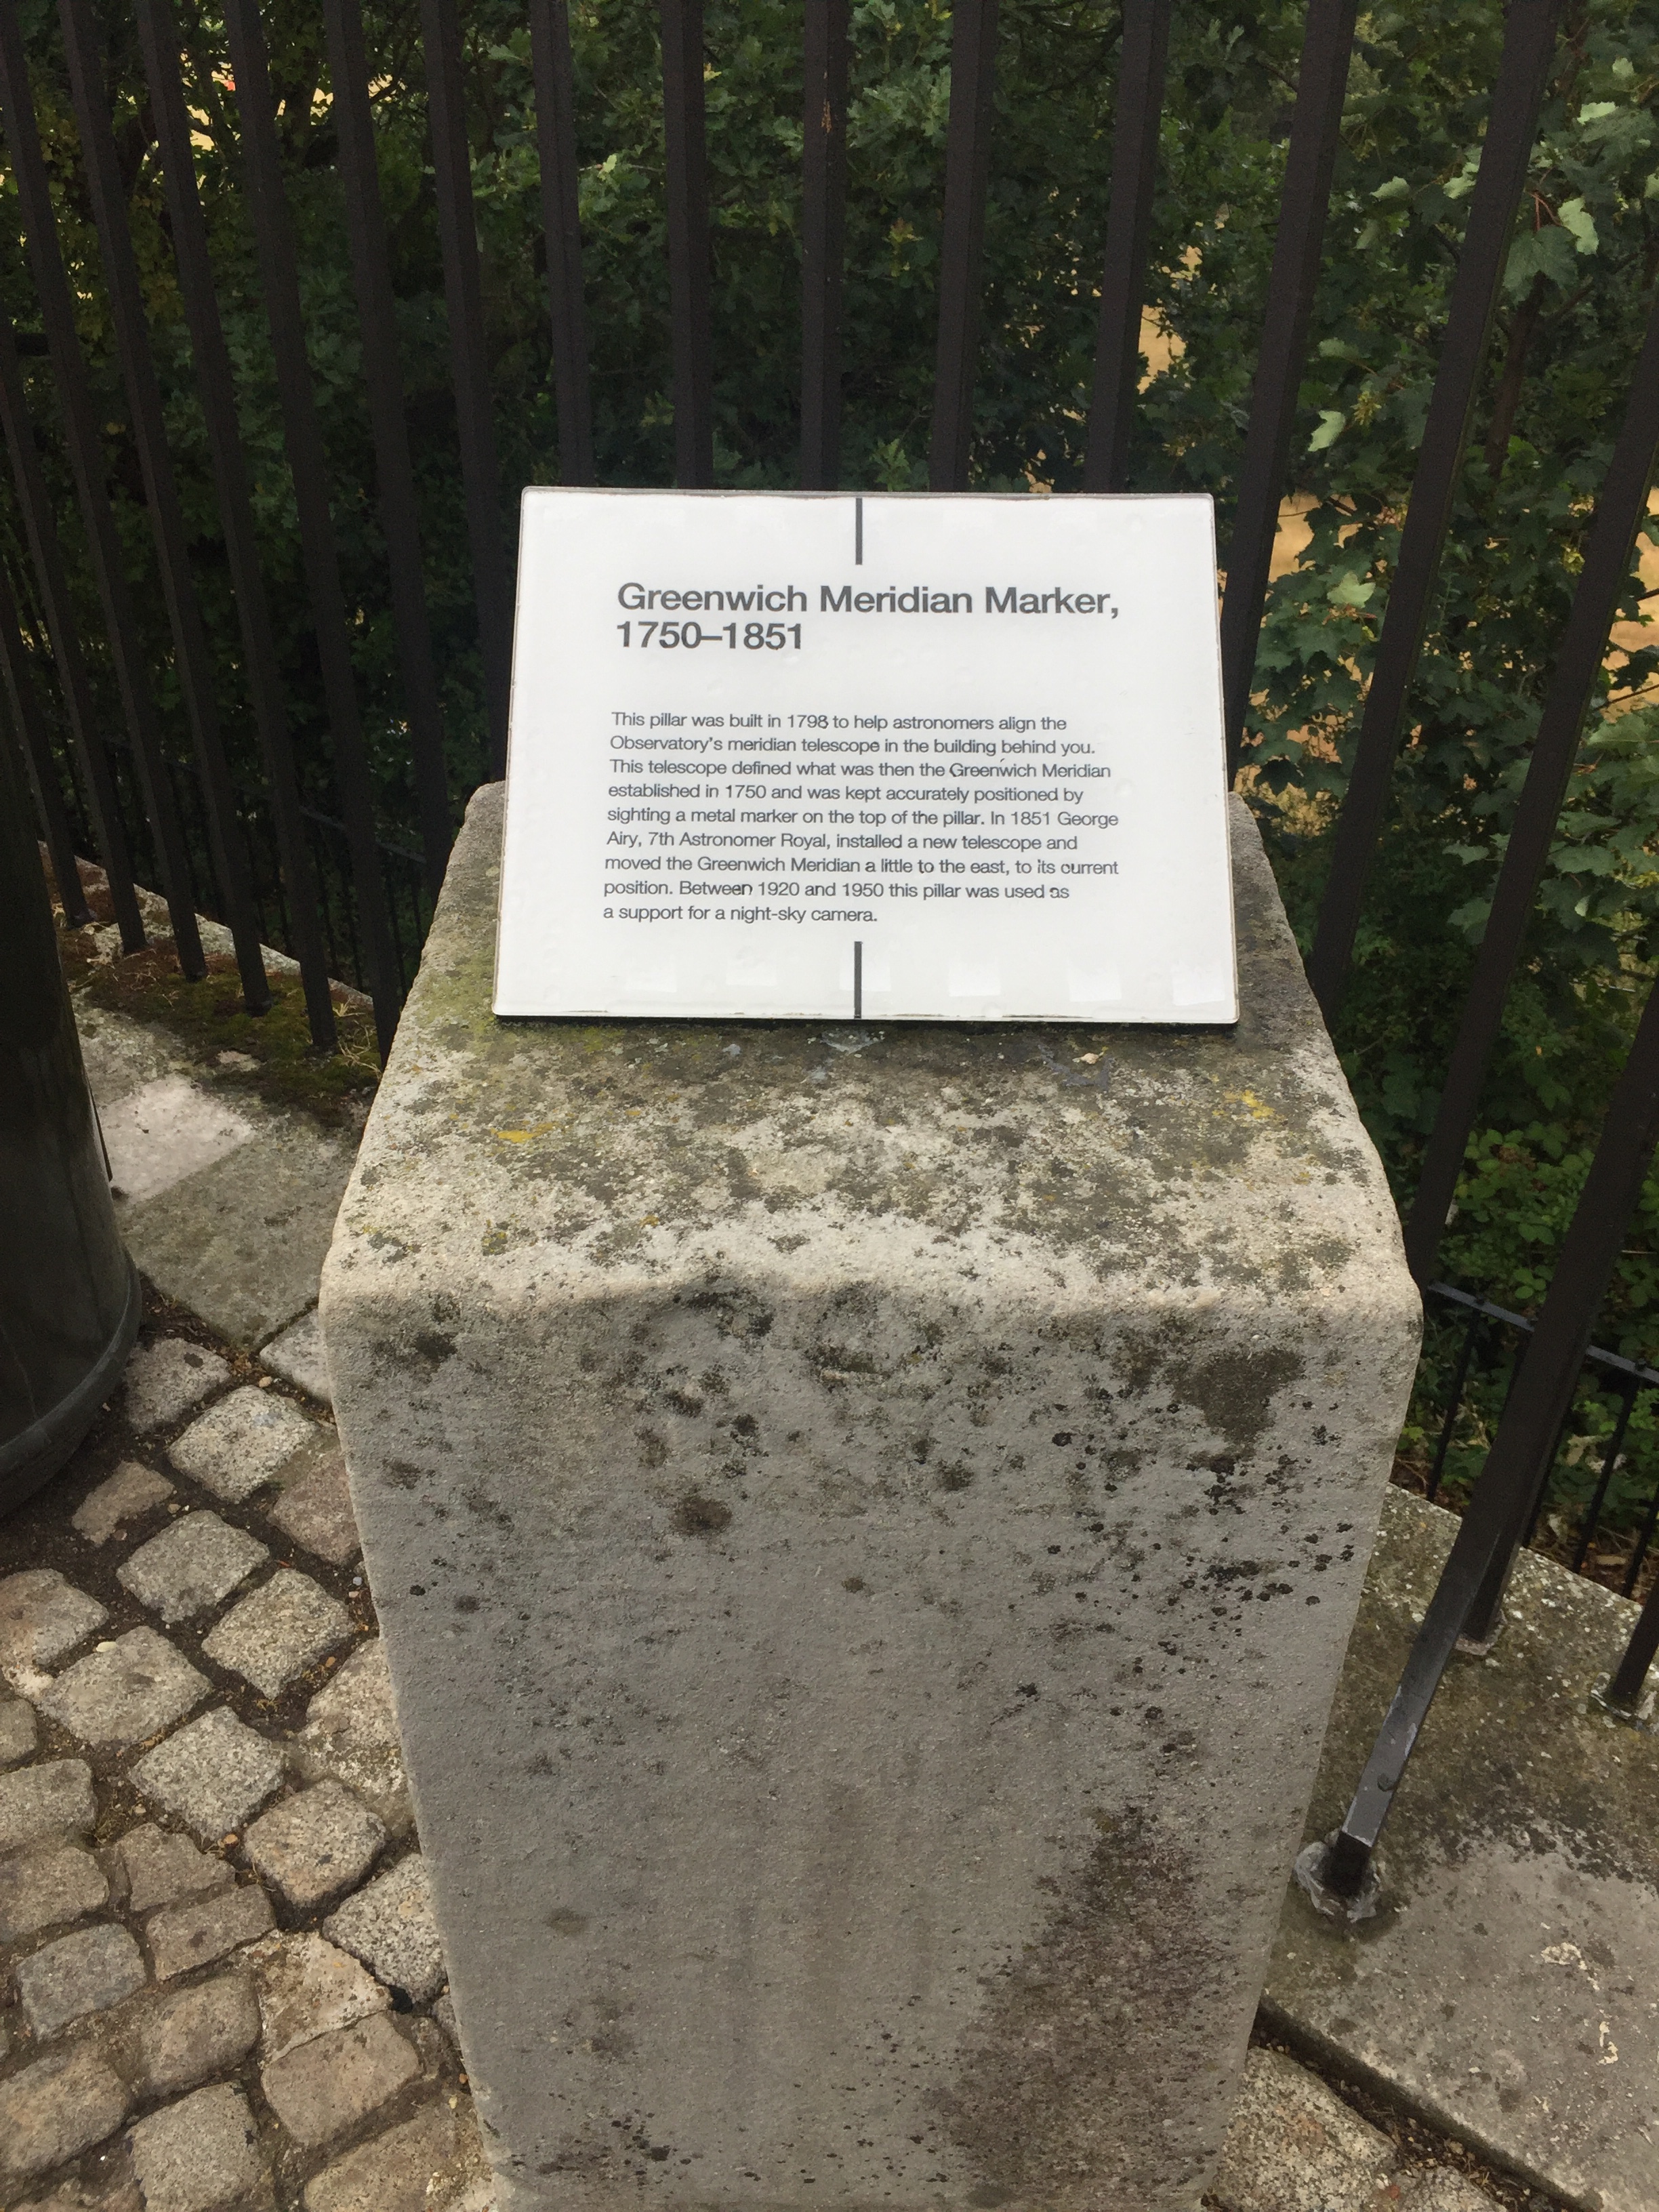
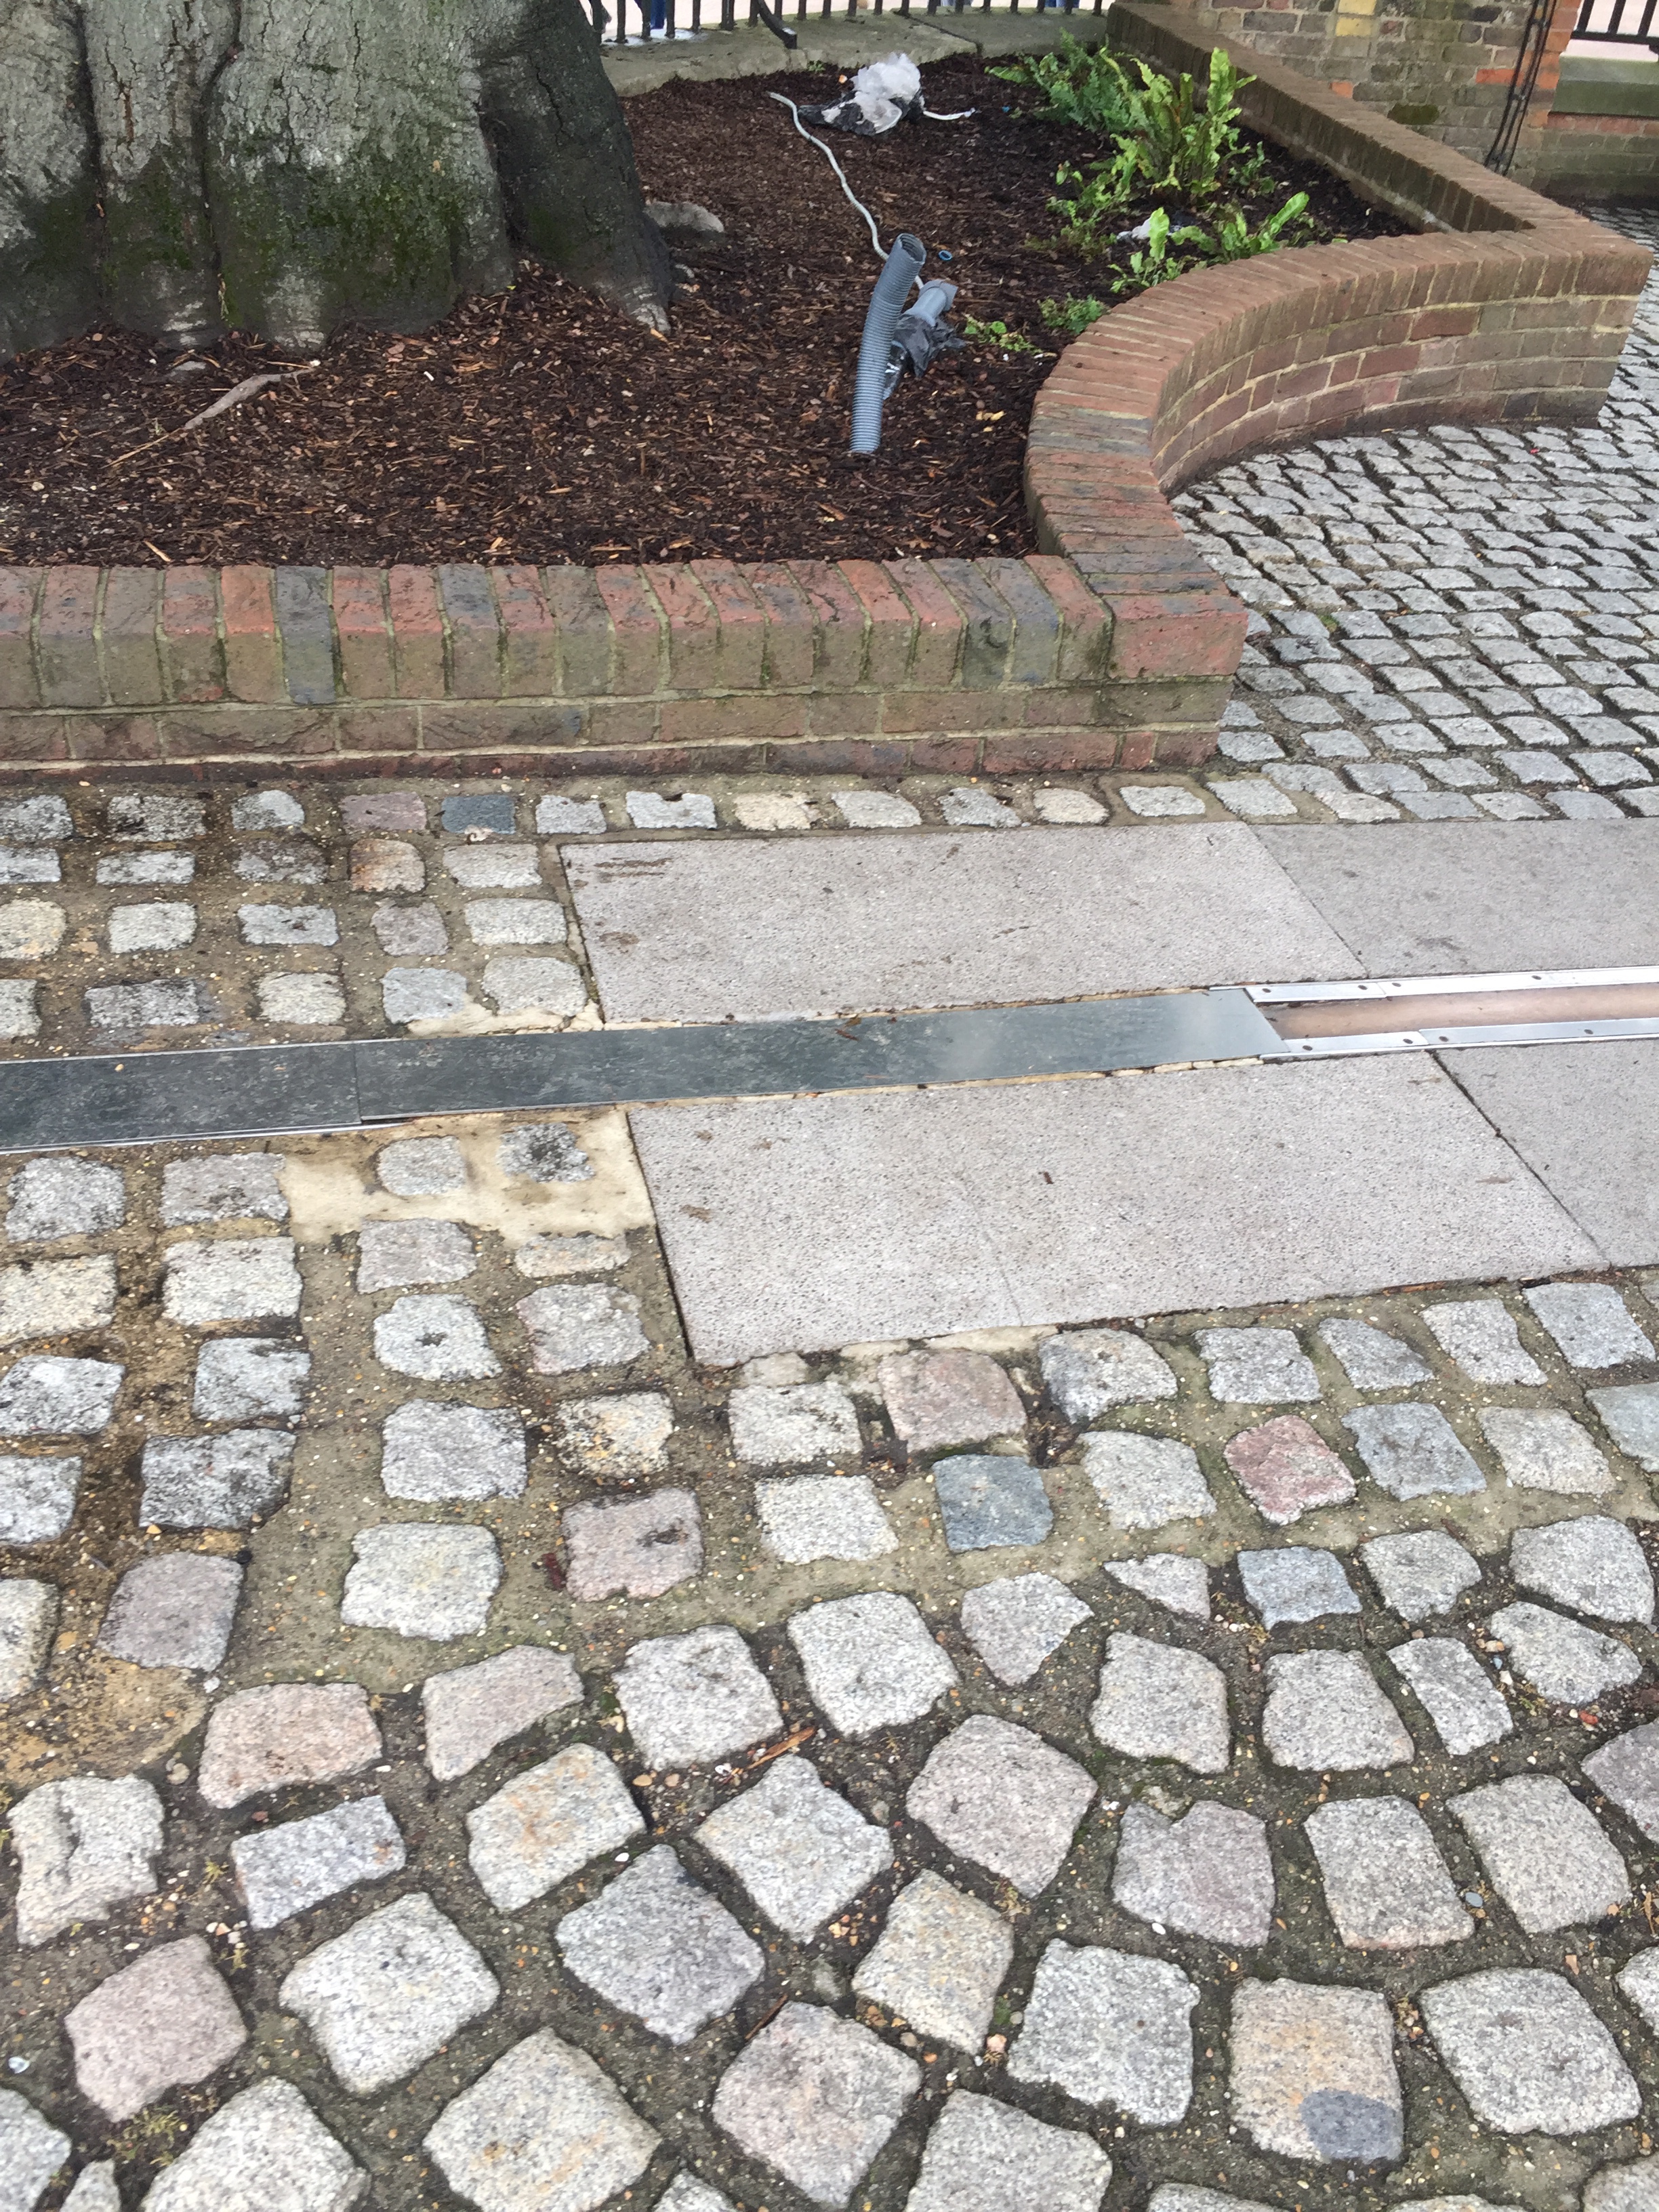
If you’ve ever been to the Royal Observatory in Greenwich, London, it might come as a shock to learn that the Prime Meridian line located there is in the wrong place. In fact, it’s out by about 100 metres. But the question is – was prime Meridian always there? It was shifted in the Royal Observatory itself.

Present Day Prime Meridian

Marker of Old Prime Meridian


Lines of latitude and longitude began crisscrossing our worldview in ancient times, at least three centuries before the birth of Christ. By a.d. 150, the cartographer and astronomer Ptolemy had plotted them on the twenty-seven maps of his first world atlas. Also for this landmark volume, Ptolemy listed all the place names in an index, in alphabetical order, with the latitude and longitude of each—as well as he could gauge them from travelers’ reports. Ptolemy himself had only an armchair appreciation of the wider world. A common misconception of his day held that anyone living below the Equator would melt into deformity from the horrible heat.

Ptolemy was free, however, to lay his prime meridian, the zero-degree longitude line, wherever he liked. He chose to run it through the Fortunate Islands (now called the Canary & Madeira Islands) off the northwest coast of Africa. Later mapmakers moved the prime meridian to the Azores and to the Cape Verde Islands, as well as to Rome, Copenhagen, Jerusalem, St. Petersburg, Pisa, Paris, and Philadelphia, among other places, before it settled down at last in London. As the world turns, any line drawn from pole to pole may serve as well as any other for a starting line of reference. The placement of the prime meridian is a purely political decision.

In 1884, at the International Meridian Conference held in Washington, D.C., representatives from twenty-six countries voted to make the common practice official. They declared the Greenwich meridian the prime meridian of the world. This decision did not sit well with the French, however, who continued to recognize their own Paris Observatory meridian, a little more than two degrees east of Greenwich, as the starting line for another twenty- seven years, until 1911. (Even then, they hesitated to refer directly to Greenwich mean time, preferring the locution “Paris Mean Time, retarded by nine minutes twenty-one seconds.”)


Since the late 19th century, the Greenwich Meridian has been the line at which most maps mark 0° longitude, the starting point for measuring geographical coordinates in an east-west direction. But we now know that the line, a physical representation of which is visited by thousands of tourists every year, should more precisely be 0.001472° (or 102.5 m) further east.

How did the Victorian astronomers who created the Meridian get their calculations wrong? It comes down to the fact that the Earth is not a perfect sphere. In order to determine the precise angle at which to position the line as it ran through the Greenwich Observatory, its creators used early instruments that were aimed vertically at what are called “clock-stars” in the night sky. These are the brighter stars, whose positions have been observed over long periods of time and can be used as reference points in the sky.

To find the exact vertical direction (a line pointing at the precise centre of the Earth’s mass) the Observatory’s astronomers first found the exact horizontal direction (at 90° to the vertical) by looking at the surface of a pool of mercury in a basin.


Today, we have the significant advantage of access to the satellite-based Global Positioning System (GPS), which does not rely on the Earth’s varying gravitational force and uses a more accurate method to calculate the centre of the planet’s mass. This has enabled scientists to determine the true vertical direction and in doing so produced a new meridian slightly to the east of the old one. Because the Earth isn’t a perfect sphere, it was impossible to simply move the new line over and maintain an accurate coordinate system.
This method, however, assumed that the Earth’s gravitational force that created the horizontal surface on the mercury was both uniform and straight down. But because the Earth is not perfectly round and local gravitational forces vary with terrain, the surface of the mercury at Greenwich was not precisely horizontal relative to the centre of the Earth’s mass. As a result, the vertical line to the stars and therefore the meridian line on the ground were slightly skewed.

Does it matter?

So what are the implications of this apparent inaccuracy, particularly given that it is the location from where every place on Earth is measured and from which all clocks are ultimately set? Fortunately, the answer is none, really.

We must remember that the position of the Prime Meridian is actually rather arbitrary and could theoretically be located anywhere. Its location through Greenwich was agreed at the International Meridian Conference of 1884 because it was the most popular candidate. Before this point, roughly ten other prime meridians were also in use, including ones through various other cities including Paris and Cadiz.

Because all important scientific measurements are today made using GPS and not the original location of the Greenwich Meridian, the impact of the error is actually minimal. Arguably, the main issues are confined to the Royal Observatory itself and how it plans to address the issue at the tourist site. There is certainly an argument for a new marker at the “true” Prime Meridian 102m to the east (although being set in one of London’s heavily regulated Royal Parks might make this somewhat problematic).

And where should we envisage the true Prime Meridian? Certainly, the new location is the more accurate line and the one that will be used in the future. But we shouldn’t forget the groundbreaking work that was conducted by scientists in centuries past with only limited tools. The fact that the two lines are just 100m apart is testament to their hard work and ingenuity and so disregarding the old line would be disrespectful. The old line will remain a historic and scientific curiosity, while the new one will allow for ever more accurate navigation within the Earth’s terrestrial, oceanic and atmospheric system.


Source(s):

The Conversion

Longitude (Book)

History of Astronomy

Posted in earth | Leave a comment