Guest Post by Joy Paley.
You hear about barometric pressure quite often actually, but unless you have a good memory of your junior high science classes, you might not have a clue what it means. Turn on the Weather Channel for the day’s forecast, and they’ll not only report the truly helpful temperature highs and lows and chance of precipitation, but that more obscure meteorological measure of barometric pressure.
The scientific explanation of barometric pressure is actually pretty simple. Barometric pressure is also known as atmospheric pressure, because it measures the pressure exerted by the weight of air above any particular place on the planet. Our atmosphere pressures us.Different layers are there.You know the earth is swathed in a layer of air between us and space—that’s why we can breathe. But, despite how it feels, that air isn’t weightless. When you’re up in a plane, for example, you know that the cabin is pressurized—there’s a lot less air pressing down on a place a mile above the earth, and so the air pressure there is much lower. When you begin your descent in that same aircraft, the water bottle you’re holding will crunch up as if squeezed by an invisible hand; the increased pressure of the atmosphere back on the earth’s surface causes the air inside the bottle to compress.
So why does the Weather Channel bother to report the barometric pressure on a daily basis to a public who could care less? The air pressure changes don’t only fluctuate with altitude, but they also shift when high and low pressure fronts of air that sweep through a particular region. A change in barometric pressure is also an indicator that the weather is changing, whether it be through a temperature shift or precipitation.
Scientific studies also point to some interesting health effects brought on by shifting atmospheric pressure. A recent one in the journal Circulation, published by the American Heart Association, showed that particular atmospheric pressures increased an individual’s risk of heart attack. The 10-year study followed over 250,000 men and recorded the temperature and barometric pressures at the time that they experienced a heart attack. These men were 12% and 11% more likely to experience a heart attack if the pressure fluctuated 10 millibars above or below 1016 millibars of pressure.
This study is one of the first to confirm this relationship between atmospheric pressure and an increased risk for heart attack, so the authors weren’t quick to put out a definitive reason as to why it has this impact. In other studies, certain atmospheric pressure ranges have been shown to increase blood pressure levels in already hypertensive patients—this correlation between atmospheric pressure and a risk factor for heart attack might be to blame.
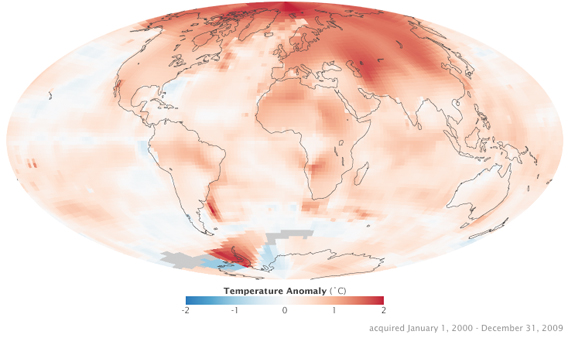
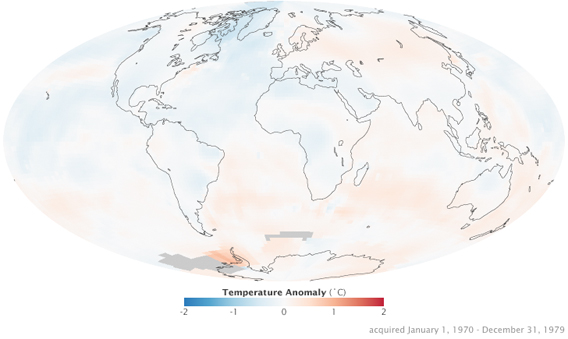
If you’re at a risk for a heart attack and interested in moving somewhere with a stable barometric pressure, these are a few cities in the world with the smallest fluctuations (as a side note though—check out the study; temperature also has a significant affect on the rate of heart attacks of men in the group). This map shows the general areas of the world with stable barometric pressure, in blue.
- Honolulu, Hawaii
- San Diego, California
- Townsville, Australia
- Bangkok, Thailand
- Santiago, Chile
Joy Paley is a science and technology writer based in Berkeley, California.