
NASA has released a new analysis of temperature change.
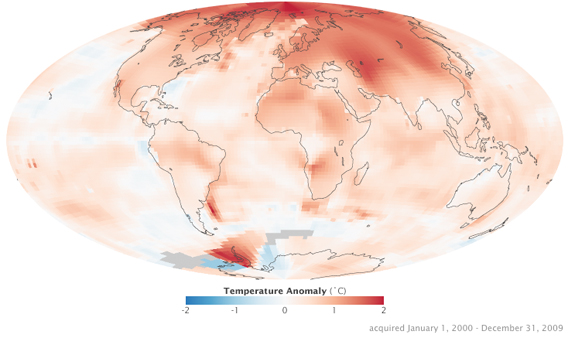
2000-2009
1970-1979
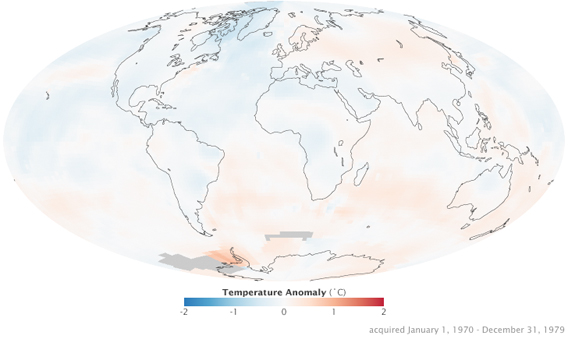
1970-1979
The map shows temperature anomalies for 2000-2009 and 1970-1979 relative to a 1951-1980 baseline.
To conduct the analysis, NASA’s Goddard Institute for Space Studies (GISS) uses “publicly available data from 6,300 meteorological stations around the world; ship-based and satellite observations of sea surface temperature; and Antarctic research station measurements.”
Source:http://news.mongabay.com/2010/1214-nasa_global_warming_map.html

